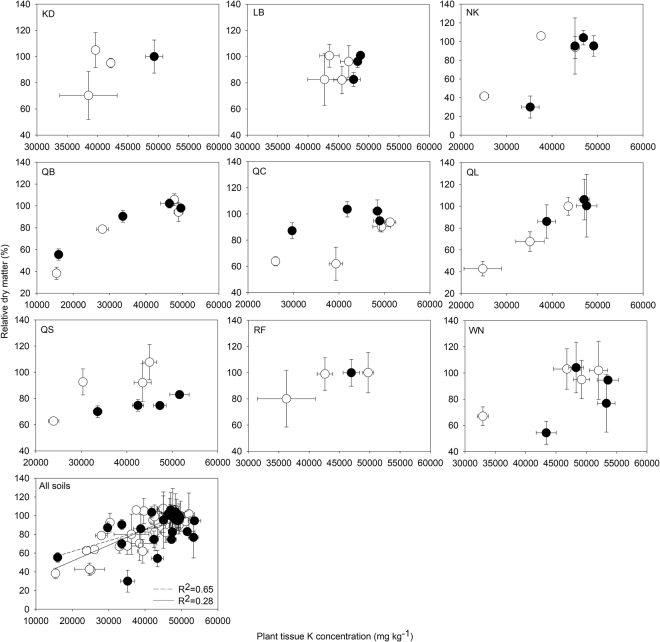
Figure 3.
Relationships between concentrations of K in shoots and relative dry matter for wheat grown in 9 contrasting soil types (open symbol represent the values obtained from small pots and closed symbols represent the values obtained from large pots). The final figure is a combined analysis across all 9 soil types, with the dashed and continuous lines representing the relationship curve for small pots and large pots, respectively. R2 in the large pots rises from 0.28 to R2 = 0.63 when soils NK and WN were excluded from the results.

