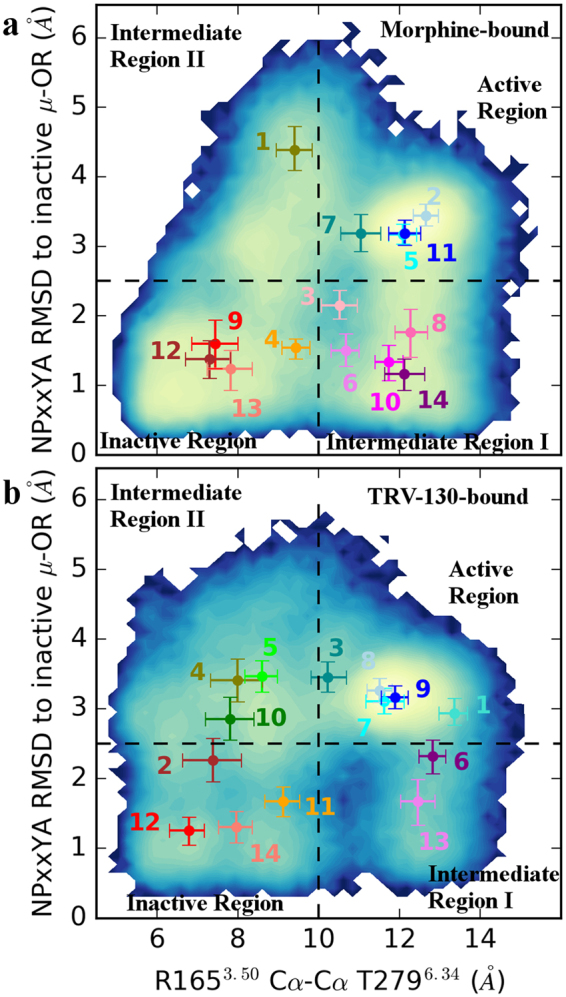
Figure 1.

Projection of kinetic macrostates onto density maps of order parameters known to describe receptor activation and sampled during simulation of the (a) morphine-bound and (b) TRV-130-bound MOR systems. Order parameters are: the TM6 outward motion relative to TM3 (represented by the R1653.50-T2796.34 Cα distance, on the x axis), and the backbone distortion involving the NPxxY motif at the TM7 cytoplasmic end (represented by the RMSD of the N3327.49-A3377.54 segment from the corresponding region in the inactive MOR crystal structure, on the y axis). The two-dimensional histograms represent the count density of these parameters calculated for each system, with increasing density values shown from blue to yellow. Dotted black lines define the boundaries of conformational regions characterized by high density of these order parameters (yellow regions). Specifically, these correspond to active and inactive crystallographic states of MOR, as well as intermediate states in regions I and II. Dots represent averages (reweighted according to the MSM stationary probability) of the two order parameters in each of the 14 macrostates identified based on kinetic similarity. These macrostates are numbered as in Supplementary Fig. 5 and are colored based on the region they fall within. Specifically, macrostates in the “Active region”, the “Inactive region”, “Intermediate region I” and the “Intermediate region II” are colored in shades of blue, red/orange, magenta, and green, respectively. Vertical and horizontal bars refer to the first (lower bound) and third (upper bound) quartiles of the distributions of the two order parameters in each macrostate.
