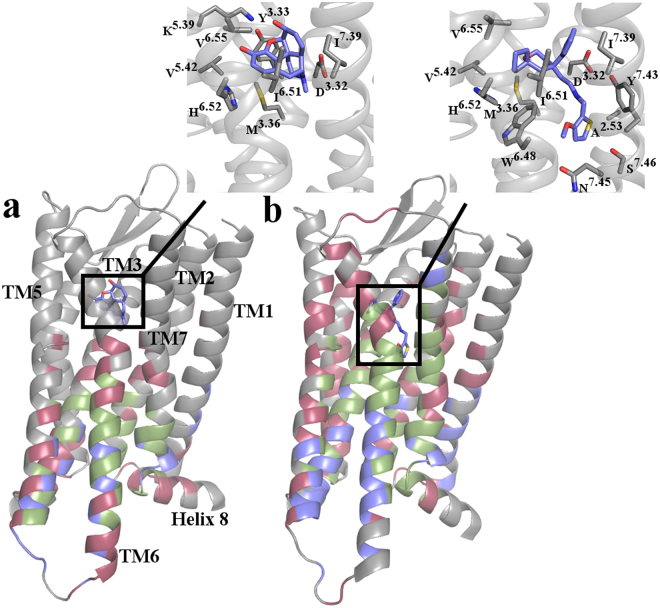
Figure 4.
Spatial distribution of top transmitters, receivers, and connectors across the two simulated ligand-bound MOR systems. Identified top transmitters (blue), receivers (red), and connectors (green) are mapped onto cartoon representations of starting conformations of (a) morphine-bound MOR and (b) TRV-130-bound MOR. Morphine and TRV-130 are shown as sticks with their carbon atoms colored in blue. Figures in insets highlight the MOR residues within 3.5 Å of the starting conformation of morphine or TRV-130, respectively. Residues are shown as sticks with their carbon atoms colored in gray.

