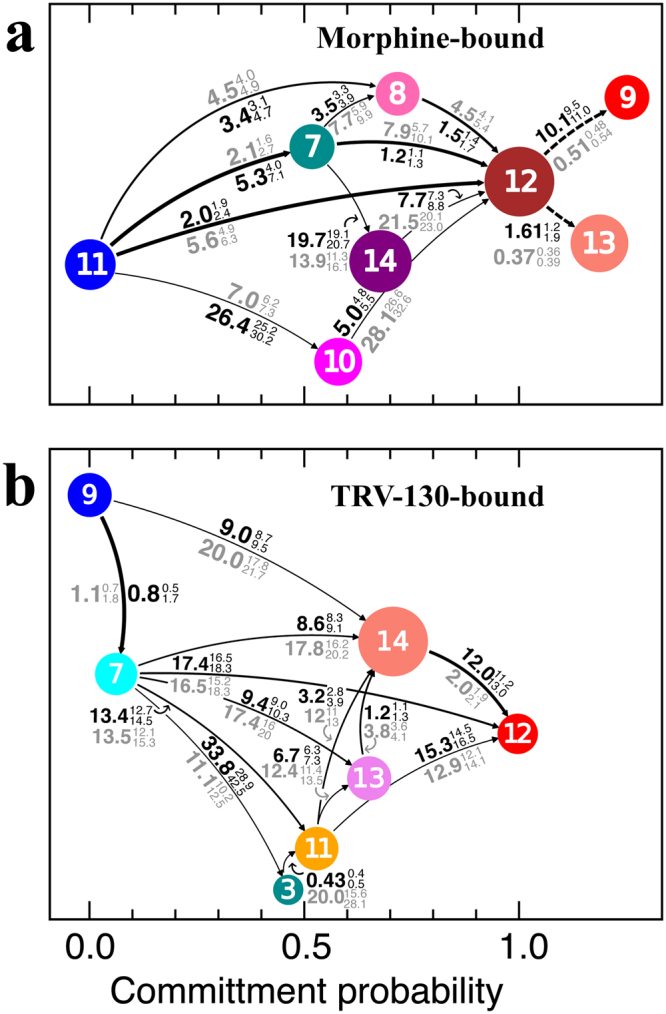
Figure 5.

Deactivation/activation pathways of morphine-bound and TRV-130-bound MOR systems. Transition path theory-predicted pathways with more than 1% of the flux linking (a) the active-like kinetic macrostate #11 and the inactive-like macrostate #12 of morphine-bound MOR, and (b) the active-like macrostate #9 and the inactive-like macrostate #12 of TRV-130-bound MOR. Arrow thickness is proportional to the net fluxes between two kinetic macrostates. Macrostates are represented as circles of size proportional to their equilibrium probability and are color-coded as in Fig. 1. Numbers next to each arrow represent the mean first passage time (in units of µs) to go from one macrostate to the other in the direction of the arrows (black) or in the reverse direction (gray). First and third quartiles are indicated as superscript and subscript, respectively. Dotted lines in panel (a) connect alternative inactive macrostates #9 and #13 that can be reached from the active state only from macrostate #12.
