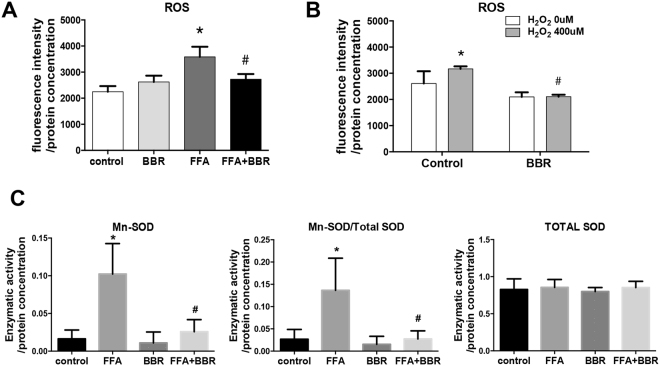
Figure 4.
BBR reduces ROS and SOD enzymatic activities. ROS concentrations were determined using DCFH-DA in Huh7 cells treated with (A) FFAs at concentrations of 200 µM OA + 100 µM PA for 8 h and with or without 10 µM BBR for 24 h. Data are expressed as the mean ± SEM. *p < 0.05 vs control, #p < 0.05 vs FFA, and (B) In the presence of H2O2 for 4 h, and treated with 10 µM BBR for 4 h. Data are expressed as the mean ± SEM. *p < 0.05 vs Control (H2O2 0 µM); #p < 0.05 vs Control (H2O2 400 µM). (C) Mn-SOD activity was determined and normalized by total SOD activity. Data are expressed as the mean ± SEM. *p < 0.05 vs control, #p < 0.05 vs FFA.

