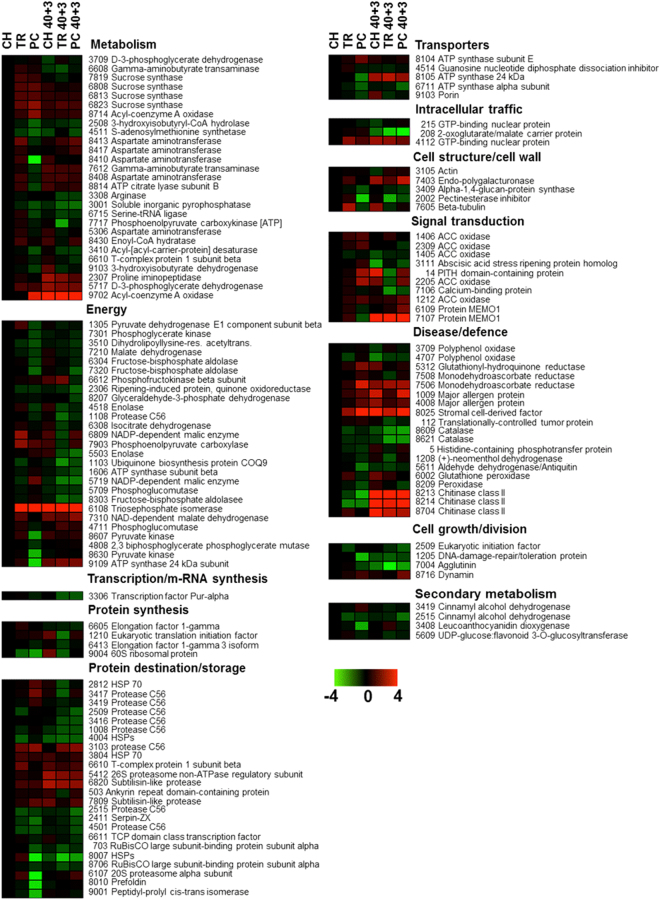
Figure 4.
Protein abundance profiling in pre-cold and CI-symptomatic peach fruit. Heat map of proteins that demonstrated statistically significant differences among treatments. Experimental details were as described (Fig. 1). The color scale illustrates the relative abundance of each protein across the three treatments; red and green indicate enhanced and reduced abundance in TR and PC samples than in CH, respectively. The color intensity indicates the degree of protein up- or down-accumulation. The number of a protein spot corresponds to that listed (Supplementary Table S4).

