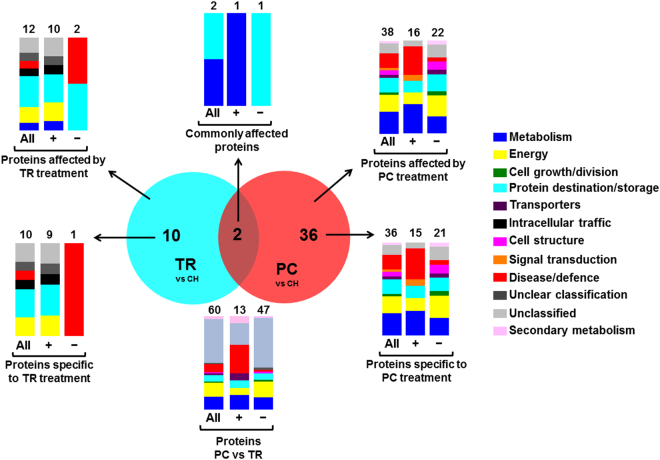
Figure 5.
Characterization of identified peach proteins accumulated during the pre-cold period. VENN diagram showing the number of commonly and uniquely expressed proteins expressed in peach in TR and PC fruit prior to cold treatment compared to CH. Additional experimental details as described (Fig. 1). Functional classification (Bevan et al.16) of peach proteins that were commonly or specifically affected by TR and PC treatments and the numbers of total, up-accumulated (+) or down-accumulated (−) identified proteins is also indicated.

