
Figure 3.
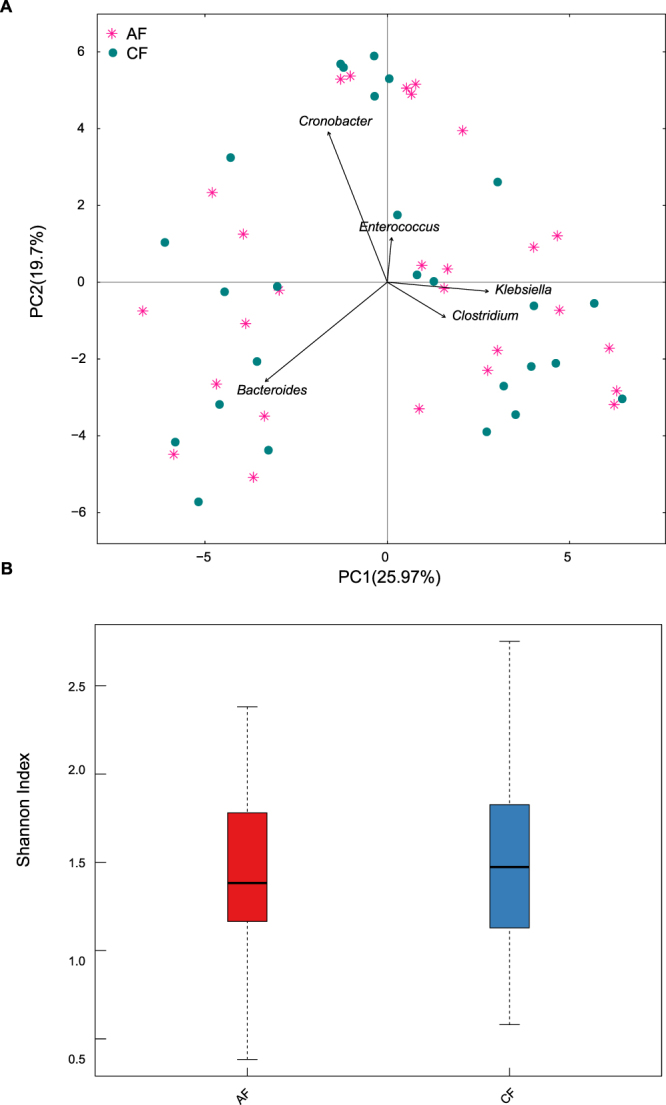
Comparison of the FM at two sampling time points in the patients. AF: within 24 h of hospitalization. CF: clinical recovery. (A) Pink plots represent the AF, and green circles represent the CF. (B) Boxplot of the alpha diversity in the FM.
Official websites use .gov
A
.gov website belongs to an official
government organization in the United States.
Secure .gov websites use HTTPS
A lock (
) or https:// means you've safely
connected to the .gov website. Share sensitive
information only on official, secure websites.
Comparison of the FM at two sampling time points in the patients. AF: within 24 h of hospitalization. CF: clinical recovery. (A) Pink plots represent the AF, and green circles represent the CF. (B) Boxplot of the alpha diversity in the FM.