Figure 2.
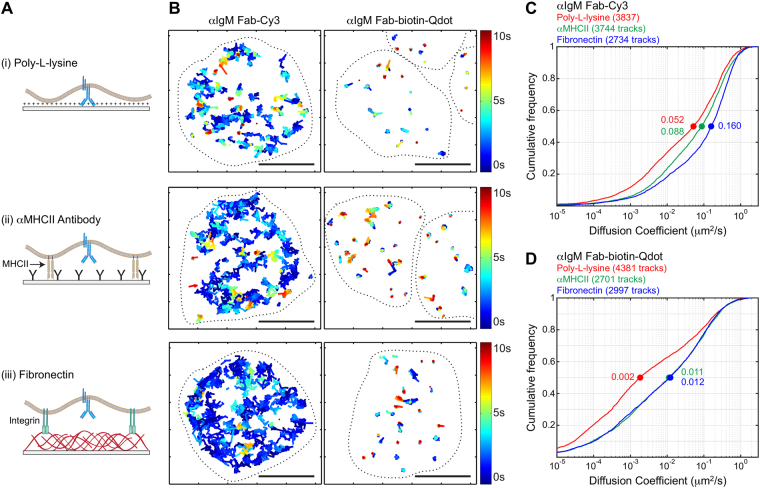
Qdot labelling fails to distinguish substrate-dependent changes in receptor diffusion. (A) Schematic representation of coverslips functionalized with (i) poly-L-lysine, (ii) anti-MHCII antibodies (αMHCII), or (iii) fibronectin, indicating the mode of cell attachment and the assumed differences in the distance between the plasma membrane and the coverslip. (B) Ex vivo murine splenic B cells were labelled and seeded onto the indicated functionalized coverslips (upper panel poly-L-lysine, middle panel αMHCII, lower panel fibronectin) before imaging by TIRFM. Trajectories are plotted using a colour-coded temporal scale. The dashed lines indicate cell boundaries. Scale bars = 5 μm. (C,D) Single-state diffusion coefficients for IgM-BCR tracks obtained using Fab-Cy3 labelling (C) or Fab-biotin-Qdot labelling (D). For all three substrates, the cumulative frequency curves of the diffusion coefficients are shown and the median values are indicated by the dots on the curves.

