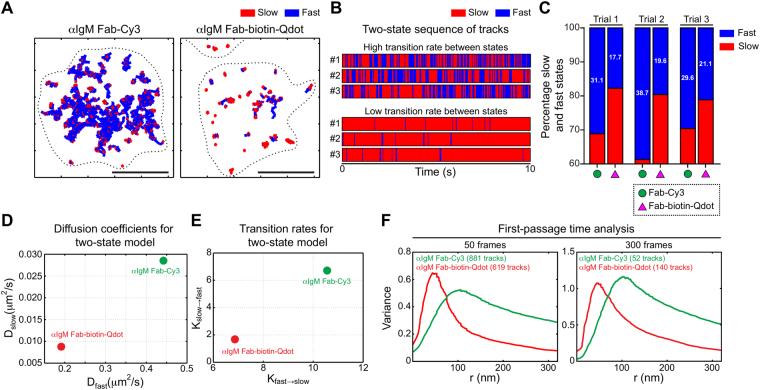
Figure 3.
Qdot labelling alters state-switching behaviour and apparent confinement of IgM BCRs. Ex vivo murine splenic B cells were labelled with anti-IgM Fab-Cy3 or anti-IgM Fab-biotin-Qdot and adhered to anti-MHCII-coated coverslips before being imaged for 10 s at 33 Hz. (A) After applying an immobility threshold to remove stuck particles (see Methods and Supplementary Fig. S2), a two-state HMM model was used to subdivide trajectories into slow-diffusing (red) and fast-diffusing (blue) segments, with dynamic transitions between these two inferred behaviours. Depicted are representative static trajectories of IgM-BCRs that were segmented into inferred slow and fast states. Scale bar = 5 μm. (B) Each barcode shows the time course for transitions between fast (blue) and slow (red) states. Shown are 3 examples of trajectories in which the receptor rapidly switches between slow and fast states (these were obtained using anti-IgM Fab-Cy3 labelling) with a high transition rate and 3 trajectories in which the receptor exhibits primarily slow diffusion, with a low transition rate (these were obtained using anti-IgM Fab-biotin-Qdot labelling). (C) For each condition, all tracks were combined and the percent of time that receptors exhibited slow (red) versus fast (blue) diffusion was determined. Data are shown for 3 independent experiments. (D,E) The HMM algorithm was then used to calculate the inferred slow and fast state diffusion coefficients (D), as well as the transition rates (Kslow→fast, Kfast→slow) (E) between the two states for receptors labelled with either anti-IgM Fab-Cy3 (green) or anti-IgM Fab-biotin-Qdot (red). Note the lower values for Fab-biotin-Qdot labelling. (F) After applying an immobility threshold to remove stuck particles, the trajectories were analyzed using the first-passage time algorithm. Histograms depicting the confinement radii for short tracks (50 frames, left panel) and long tracks (300 frames, right panel) are shown. The numbers of tracks analyzed are indicated. Note that Fab-Cy3 labelling yields larger confinement radii.

