Figure 5.
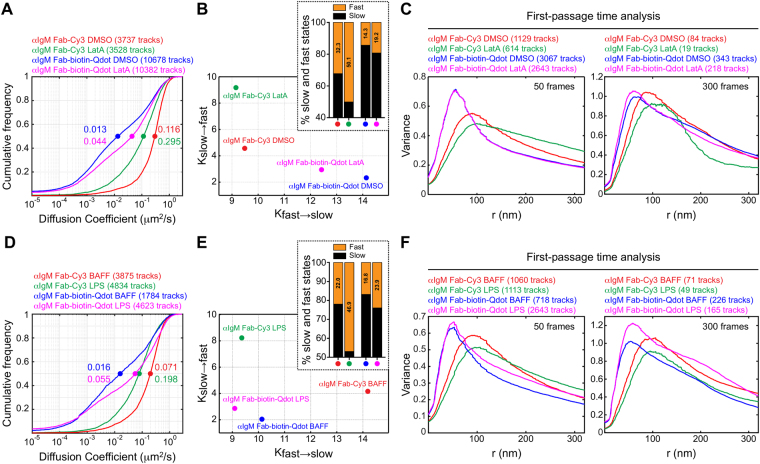
Larger changes in receptor mobility can be detected using Qdots. (A–C) Ex vivo splenic B cells were labelled with either anti-IgM Fab-Cy3 or anti-IgM Fab-biotin-Qdot. The cells were treated with DMSO or 1 μM latrunculin A (LatA) for 5 min prior to SPT imaging. Cumulative frequency plots of single-state diffusion coefficients for IgM-BCRs are shown in (A). Median values are indicated by the dots. (B) The tracks were analyzed using the two-state HMM. The transition rates (Kslow→fast, Kfast→slow) between the two states are shown. The inset shows the fraction of time that receptors exhibited slow (black) versus fast (orange) diffusion, as determined using the two-state HMM. All data are from the same experiment. Similar results were obtained in three independent experiments. (C) The trajectories were analyzed using the FPT algorithm and histograms depicting the confinement radii for short tracks (50 frames, left panel) and long tracks (300 frames, right panel) are shown. (D–F) Splenic B cells were cultured for 16 h with 5 ng/mL BAFF or with BAFF + 5 μg/mL LPS before being labelled with either anti-IgM Fab-Cy3 or anti-IgM Fab-biotin-Qdot. (D) Cumulative frequency plots of diffusion coefficients are shown. (E) The transition rates between slow- and fast-diffusion states determined by the HMM algorithm. The fraction of time that receptors exhibited slow (black) versus fast (orange) diffusion are shown in the inset. (F) The trajectories were analyzed using the FPT algorithm and histograms depicting the confinement radii for short and long tracks are shown. All data are from the same experiment. Similar results were obtained in two independent experiments.

