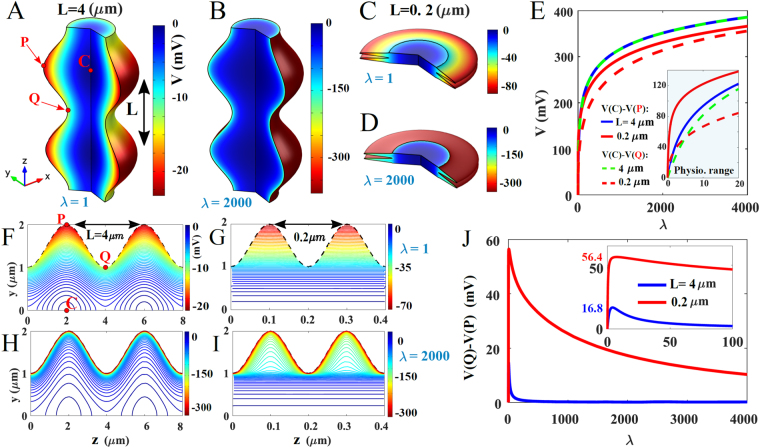
Figure 1.
Numerical evaluation of voltage distribution in a corrugated cylinder (A–D). Voltage distribution computed for λ = 1 (A–C) and λ = 2000 (B–D). The boundary of the cylinder around the symmetry z− axis is defined by the curve γ(z) = 1 + 0.5 sin(2πz/L), where L is a parameter (L = 4 μm (A,B), and L = 0.2 μm (C,D). (E) Voltage differences V(C) − V(Q) (dashed line) and V(P) − V(C) (solid line) versus λ, computed for L = 0.2 μm (red) and L = 4 μm (blue, green), where P (resp. Q) is the maximum (resp. minimum) of the curve γ(z) and C is defined by V(C) = min(V).The inset panel in (E) represents a magnification of the range of λ corresponding to physiological values of the voltage. (F–I) Isopotential lines in the yOz plane, computed for various (λ, L): (F) (1, 4), (G) (1, 0.2), (H) (2000, 4), and (I) (2000, 0.2). (J) Voltage difference V(Q) − V(P) versus λ, computed for L = 4 μm (blue) and L = 0.2 μm (red). The inset in panel J is a magnification of the small λ region.

