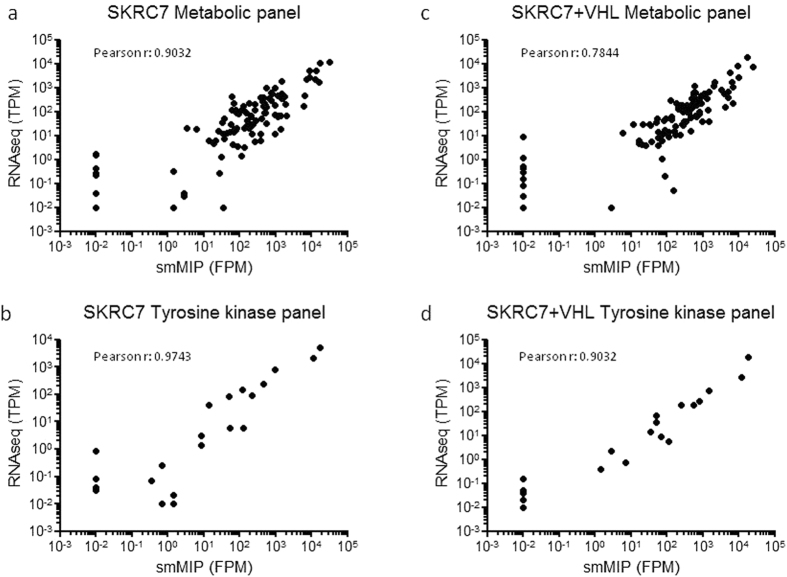
Figure 3.
smMIP-based targeted RNA sequencing correlates well with whole transcriptome RNAseq. Mean smMIP-based metabolic FPM levels (a,c) and tyrosine kinase transcript FPM levels (b,d) were plotted to TPM levels of the same transcripts, extracted from whole RNAseq data. Note that the transcripts with very low FPM values (10−2FPM) were not detected in the RNAseq dataset. We included these transcripts in these analyses although they may have lowered the Pearson coefficient.

