Figure 7.
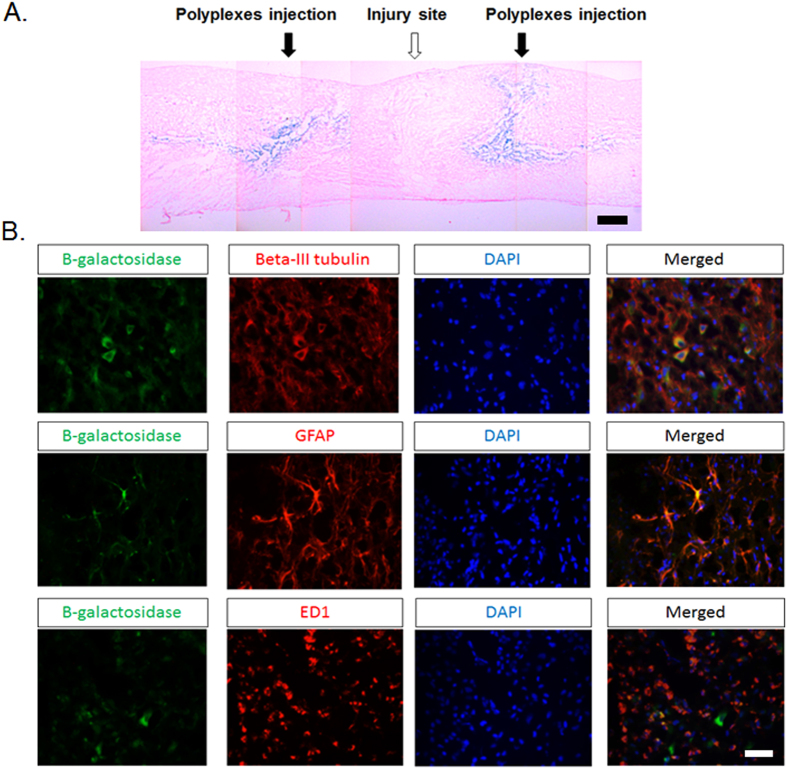
(A) Representative image of β-Gal expression (blue staining) in SCI model 7 days after injection of PgP/pβ-gal polyplexes at N/P ratio 30/1. Scale bar indicates 400 µm. (B) Double immunohistochemical staining for β-Gal+ cells (green) and beta-III tubulin (red, Left), GFAP (red, Middle) and ED-1 (red, Right) in SCI region. Merged images show co-localization of β-Gal+ cells and beta-III tubulin+ neurons, GFAP+ astrocytes, and ED-1+ microglia cells/infiltrated macrophages. Scale bar indicates 50 µm.

