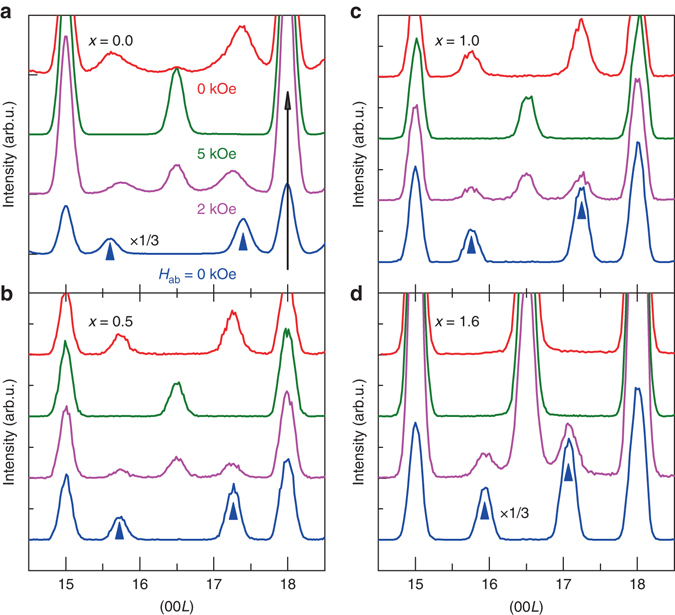
Fig. 4.

Neutron diffraction of Ba2-xSrxMg2Fe12O22 at 1.5 K. Neutron diffraction (0 0 L) scan profiles under different H ab for a x = 0.0, b x = 0.5, c x = 1.0 and d x = 1.6 samples. All the samples initially experienced zero-field cooling down to 1.5 K. Then the magnetic field was changed in the order 0 kOe → 2 kOe → 5 kOe → 0 kOe. (0 0 15) and (0 0 18) peaks are the nuclear diffraction peaks and L = 3(n ± δ) denote magnetic diffraction peaks. The arrows indicate magnetic diffraction peaks (0 0 3n ± 3δ 0) after initial zero-field cooling process
