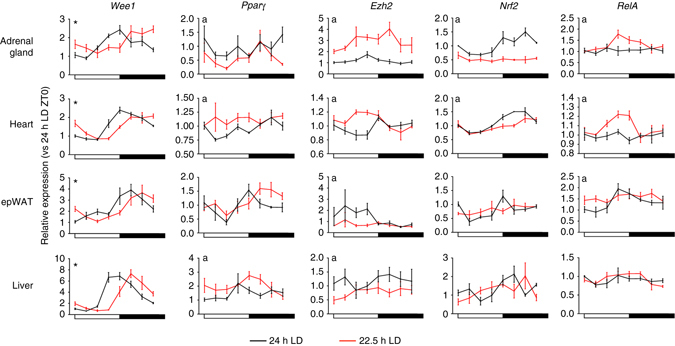
Fig. 4.

Phase misalignment disrupts rhythmic gene expression in a pathways and tissue-specific manner. Transcript profiles of major clock-controlled regulator genes of cell cycle (Wee1), epigenetic regulation (Ezh2), metabolism (Pparγ), oxidative stress (Nrf2) and inflammation (RelA) from mice housed in 24 or 22.5 h conditions for 17 weeks. All data plotted mean ± SEM relative to the respective light cycle (24 or 22.5 h) and normalised to ZT0 of the 24 h LD group (n = 4/time-point/group). ∗Significant (p < 0.05) difference in phase between 24 and 22.5 h profiles; a = significant difference in amplitude or mesor between 24 and 22.5 h LD conditions (sinusoidal waveform fits with F tests for shared characteristics)
