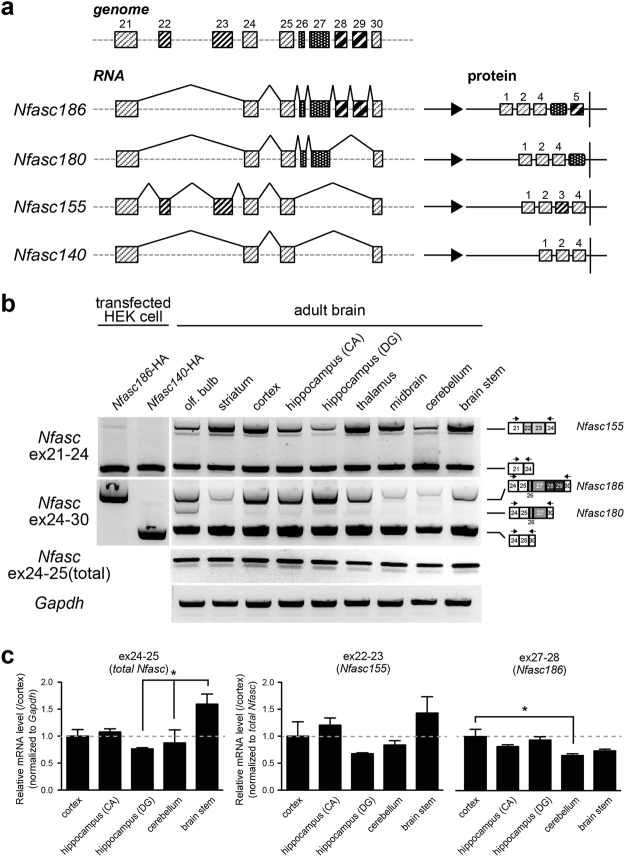
Figure 2.
Distinct neuronal neurofascin gene (Nfasc) splicing across the adult brain. (a) Schematic diagram outlining partial genomic organization of Nfasc at ex21-30 and the alternative splicing patterns that generate four protein splice isoforms. Exon positions of each alternatively spliced segment (ex22-23, ex26-27, and ex28-29) are indicated by different boxes. (b) Detection of alternative splicing choices at ex26-29 (neuron-specific splices) by semi-quantitative RT-PCR. Primer sets used for the analysis were designed on the neighbouring constitutive exon sequence. Different splicing patterns at ex26-29 among brain areas was largely consistent with the pattern of protein isoforms in data shown in Fig. 1 (n = 3 animals). (c) Quantification of total Nfasc (ex24-25), Nfasc155 (ex22-23), and Nfasc186 (ex27-28) levels by RT-qPCR. Total Nfasc: F (4,14) = 3.919 (P < 0.05); Nfasc155: F (4,14) = 2.188 (P = 0.15); Nfasc186: F (4,14) = 4.581 (P < 0.05), one-way ANOVA. Asterisks show the significant differences when compared between all the tissues with post-hoc test (Bonferroni’s multiple comparison test) (n = 3 animals).

