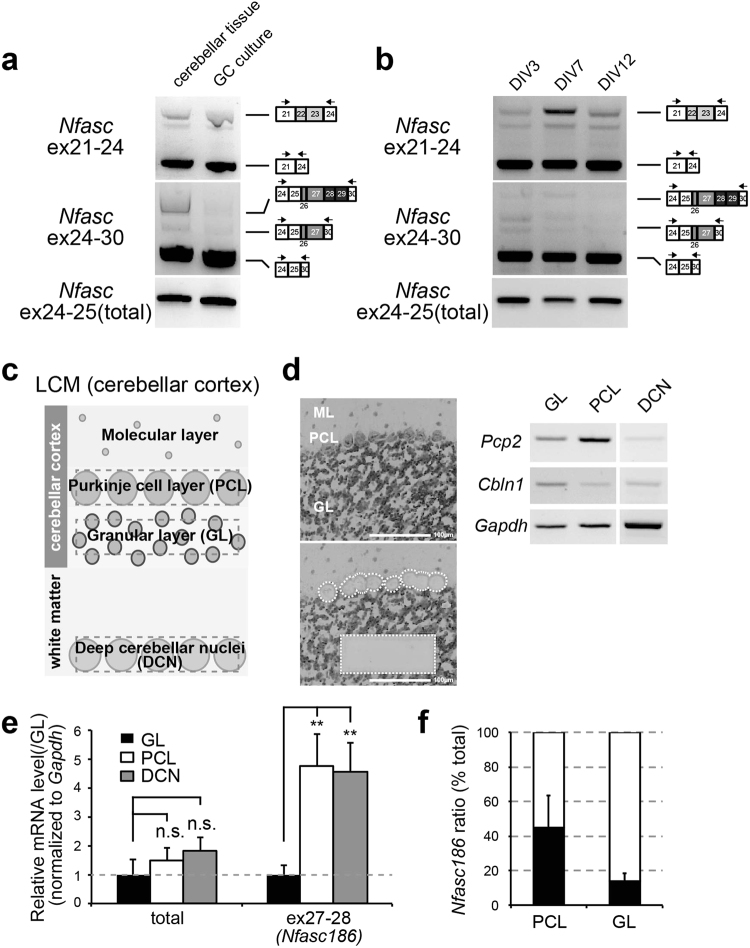
Figure 4.
Cell type–specific alternative splicing of Nfasc in the adult cerebellum. (a) Comparison of the inclusion patterns at ex22-23 and ex26-29 between Nfasc in whole cerebellar tissue and in granule-cell (GC) cultures. Inclusion of ex26-29 was remarkably less in GC cultures. (b) Inclusion patterns at Nfasc ex22-23 and ex26-29 between time points in developing GC cultures. Inclusion of ex26-29 did not occur developmentally in GC cultures. (c) Illustration of separation and cell isolation by laser-capture microdissection (LCM). The Purkinje cell (PC) layer (PCL), granule layer (GL), and deep cerebellar nuclei (DCN) were isolated from single cerebellar slices. (d) Representative images of LCM isolates in the cerebellar cortex and verification by standard PCR using primer sets for cell type-specific markers; Pcp2 (for PCs) and Cbln1 (for GCs). Scale bar = 100 μm. (e) RT-qPCR analysis using LCM-isolated cerebellar tissue. Nfasc186 containing ex27-28 was 4–5 fold higher in the PCL and DCN than in the GL (n = 4 animals). Values for GL were set to 1.0. Differences were compared to the values for GL. (f) A ratio of Nfasc186 in the PCL and GL by qRT-PCR analysis (n = 4 animals). Approximate percentage of Nfasc186 isoform was largely estimated from CT value of ex27-28 directly compared to that of total Nfasc (ex24-25) at the same threshold set for CT value. Mean CT values for total Nfasc were set to 100%.

