Figure 5.
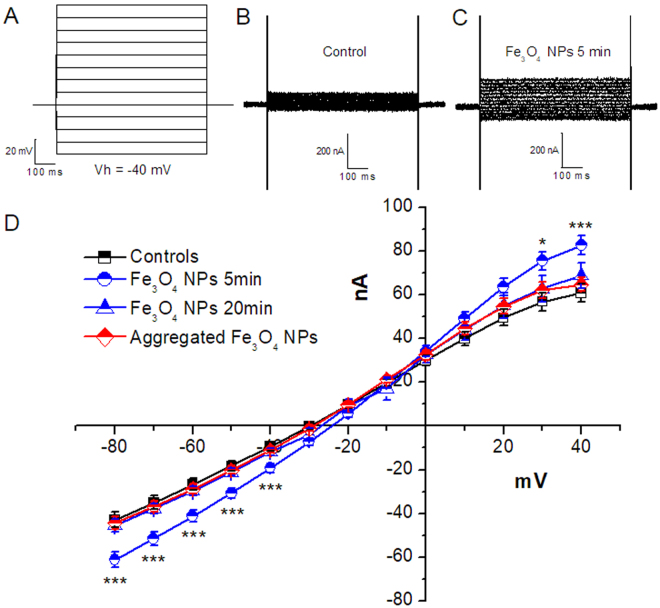
Membrane currents recorded in oocyte exposed or not to Fe3O4 NPs. (A) Voltage Protocol: from holding potential of −40 mV, 10 mV steps of 1 s were applied from −80 mV to +50 mV. Representative traces recorded from oocytes not exposed (B) or (C) exposed for 5 min to Fe3O4 NPs. In D, the averages of steady state membrane currents are reported as I-V relationships. After 5 min of NP exposure (blue circles), a slight, but statistically significant current increase is recorded at the curve extremes; after 20 min (blue triangles), no more statistically significant differences can be appreciated. Aggregated NP treatment generated in oocytes currents (red diamonds) almost overlapping with controls (black squares) and 20 min treatment currents, and that is an indication of the inefficacy of this treatment (*p < 0.05, ***p < 0.005; one-way ANOVA, Holm-Bonferroni post hoc orthogonal comparison; 14 to 30 oocytes from 2 batches).

