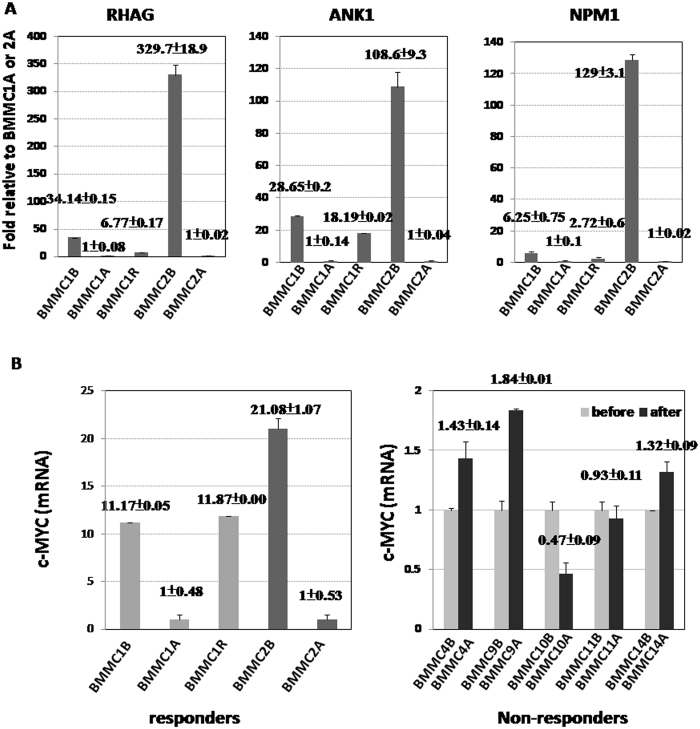
Figure 4.
mRNA expression of associated genes in responders and non-responders before and after ADI-PEG20 treatment. (A) The relative mRNA expression levels of RHAG, ANK1, and NPM1 in the bone marrow mononuclear cells (BMMCs) of Case 1 and Case 2 at the indicated time points by QR-PCR. BMMC1B is the BMMCs of Case 1 before ADI-PEG20 treatment. BMMC1A is the BMMCs of Case 1 after ADI-PEG20 and in complete remission status. BMMC1R is the BMMCs of Case 1 collected at the time of relapse after ADI-PEG20 treatment. BMMC2B is the BMMCs of Case 2 before ADI-PEG20 treatment. BMMC2A is the BMMCs of Case 2 after ADI-PEG20 and in complete remission. The samples of BMMC1B and BMMC1R were compared with BMMC1A for analysis. The sample of BMMC2B was compared with BMMC1A for analysis. (B) The mRNA expression of c-MYC in AML cases responsive and non-responsive to ADI-PEG20. (left) Fold changes of mRNA expression of c-MYC in BMMC1B, and 1 R relative to BMMC1A and in BMMC 2B relative to BMMC2A. Case 1 and Case 2 were responders to ADI-PEG20. (right) Fold changes of mRNA expression of c-MYC in BMMC4A, 9 A, 10 A, 11 A, and 14 A relative to BMMC4B, 9B, 10B, 11B, and 14B, respectively. Cases 4, 9, 10, 11, and 14 were non-responders to ADI-PEG20. (Cases 4, 10, and 11were PD; Cases 9 and 14 were SD) “A” indicates after ADI-PEG20, “B” indicates before ADI-PEG20.

