Figure 5.
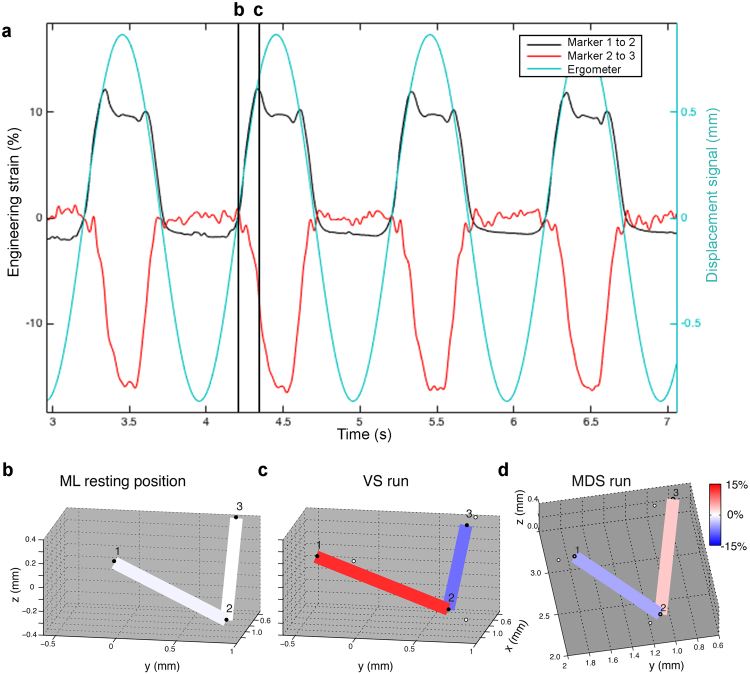
Stress-strain relationships for VS and MDS runs based on 3D stereoscopic marker tracking. (A) Inter-marker distances as engineering strain (v1, black; v2, red traces; left y-axis) and the displacement signal (light blue; right y-axis) during four successive cycles in a VS actuation run. At ~10% tissue strain, further displacement of MVC does not result in an increase in tissue strain. (B–D) Marker positions (black dots) at (B) resting position of ML, (C) maximal strain of ML during VS actuation run and (D) maximal strain during MDS actuation run. The strain increase (red) in the direction of the muscle line of action (VS in C and MDS in D) is accompanied by a strain decrease (blue) in the perpendicular direction. The white dots in panel C indicate the resting position of the markers (panel B). The exact orientation of the x,y and z axes and reference point (0,0,0) are defined by the position of the calibration wand during the calibration procedure. Please see Supplementary Videos S1 and S2 online for animations of the strain changes in ML during a VS and MDS run.

