
Figure 1.
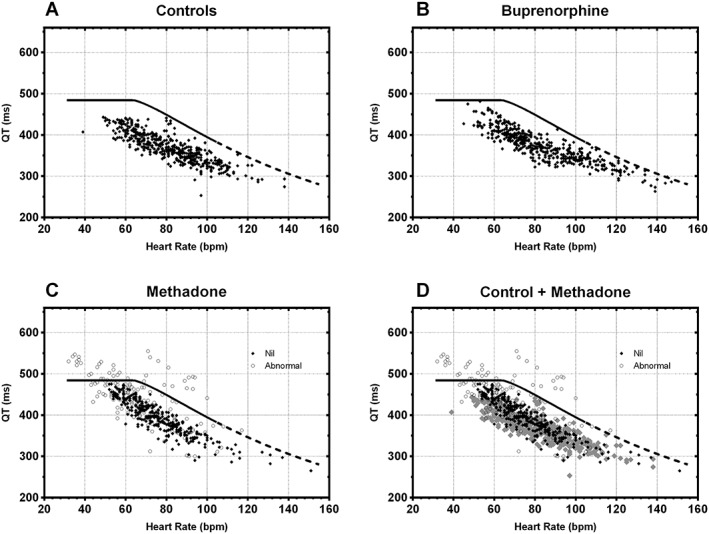
The QT nomogram with plots of multiple QT intervals vs. heart rate (QT‐HR pairs) recorded from each patient including the at‐risk line for (A) the 19 control patients, (B) 20 patients prescribed buprenorphine, (C) 19 patients prescribed methadone and (D) for a comparison of controls and patients prescribed methadone. Points are black diamonds for patients where their QT interval remains under the at‐risk line and open black circles if they are abnormal QT interval. In Panel D, the control patients are in grey