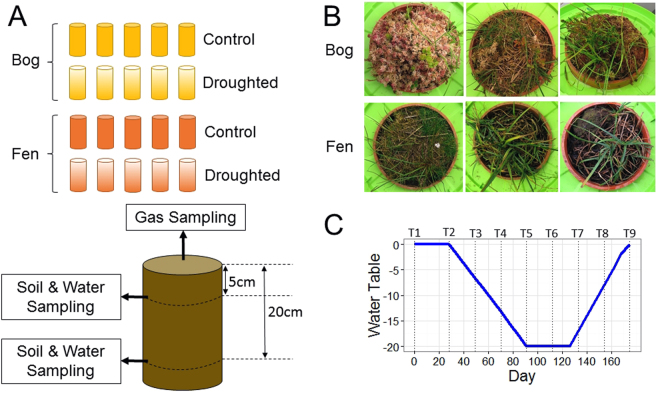
Figure 1.
Schematic showing aspects of the experimental design. (A) Overview of the experiment showing the number of mesocosm cores collected for each treatment and habitat, as well as depths at which sample collection was carried out. (B) View of mesocosm cores from above, giving an indication of typical vegetation in bog and fen. (C) Position of the water table throughout the experiment, with sampling time points indicated by dotted lines. Biogeochemical measurements (including measurement of gas fluxes) were carried out on samples taken from all mesocosm cores, but it was only possible to analyse DNA from a randomly selected subsample of three mesocosm cores within each combination of treatment and habitat.

