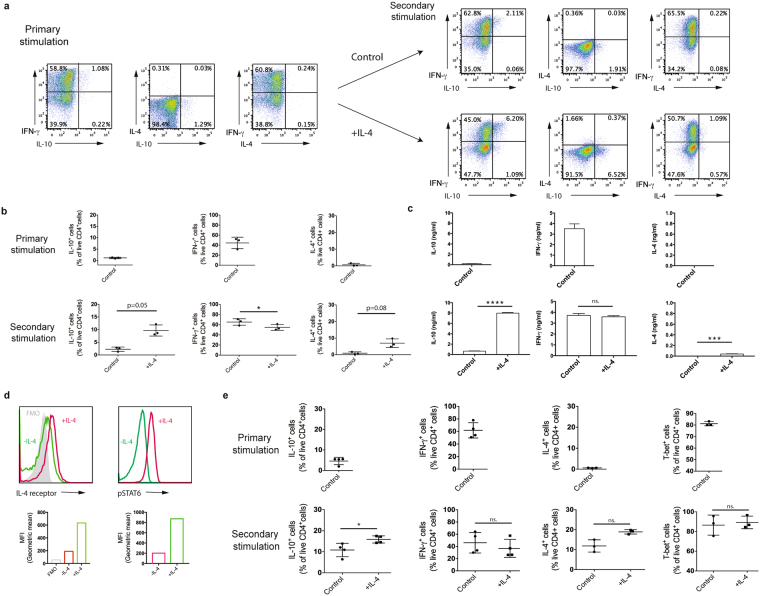
Figure 4.
IL-4 induces IL-10 production in polarised Th1 cells. (a–c) Polarised Tg4 Th1 cells (Primary stimulation) were stimulated for a further cycle (Secondary stimulation) with irradiated B10.PL splenocytes APCs with MBP Ac1-9[4Y] in the presence of IL-12 (Control) or IL-12 and exogenous IL-4 (+IL-4). Intracellular cytokine staining was carried out on day 7 of each stimulation following PMA and ionomycin stimulation. (a) Representative FACS plots of three independent experiments are gated on live CD4+ cells and show IFN-γ, IL-4 and IL-10 expression. (b) Pooled quantitation of IL-10+, IFN-γ+ and IL-4+ live CD4+ cells from three independent experiments as shown in (a). Error bars are mean ± SEM. n.s (not significant) p > 0.05, *p ≤ 0.05 (Student’s paired t-test). (c) Tissue culture supernatants were taken on day 7 of each stimulation and analysed for IL-10, IFN-γ and IL-4 by ELISA. Data are mean + SD from triplicate wells from one experiment, representative of two independent experiments. n.s. (non-significant) p > 0.05, ***p < 0.001, ****p < 0.0001 (Student unpaired t-test). (d) Polarised CD4+ selected Th1 cells were stimulated with anti-CD3 for 20 minutes in the presence of IL-4. Histograms of IL-4 receptor and phospho-STAT6 staining gated on live CD4+ cells and graphs of geometric mean fluorescence are shown and are representative of two independent experiments. (e) Polarised CD4+ selected Th1 cells (Primary stimulation) were stimulated for a further cycle of 7 days (Secondary stimulation) with anti-CD3 and anti-CD28 in the presence of IL-12 (Control) or IL-12 and exogenous IL-4 (+IL-4). Intracellular cytokine staining for IFN-γ, IL-4 and IL-10 was carried out on day 7 of each cycle of stimulation following PMA and ionomycin stimulation. Graphs show pooled quantitation of IL-10+, IFN-γ+ and IL-4+ live CD4+ cells from four independent experiments. Error bars are mean ± SEM. n.s (not significant) p > 0.05, *p ≤ 0.05 (Student paired t-test).

