Figure 2.

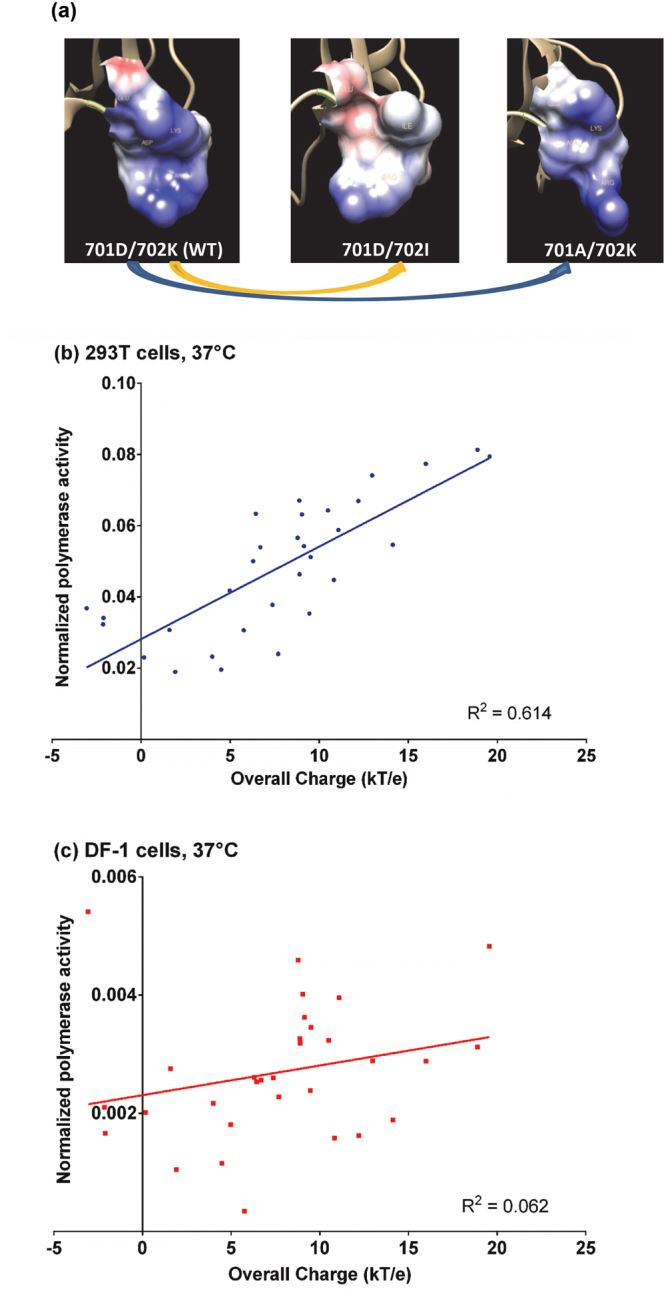
Correlation between surface electrostatic charge and polymerase activity. (a) Structural model of the PB2 C-terminal was predicted by the web-server Geno3D and visualized with Chimera. The protein surface was presented from PB2 residues 700 to 703 (left). Coulomb’s law was applied to estimate the electrostatic potential, in which blue and red color indicated positively and negatively charged surface respectively. A change in surface electrostatic charge were observed with PB2-701 or PB2-702 mutation (middle and right). Correlation analyses were performed between overall surface charge of the PB2-700 to 703 region and polymerase activities in (b) 293T cells and (c) DF-1 cells at 37 °C. Overall surface charge, in the unit of kT/e, was defined as the sum of the charges from residues 700 to 703 determined by Coulomb’s law.
