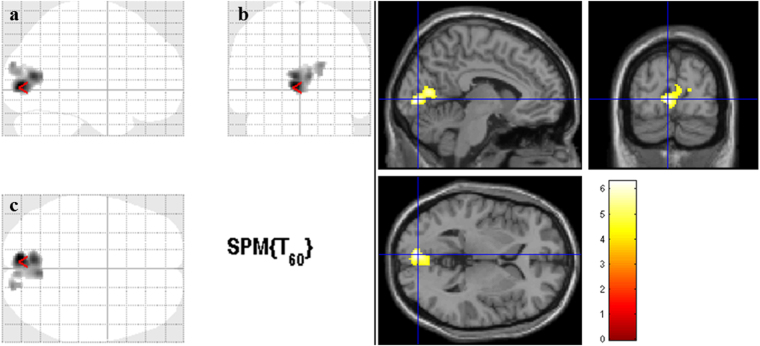
Figure 1.
Gray matter volume reduction in Retinitis Pigmentosa patients. Cortical areas with significant gray matter volume reduction in Retinitis Pigmentosa patients when compared to controls for the whole brain analysis (p < 0.01, False-Discovery-Rate correction for multiple comparisons and a cluster size correction of 20 voxels). The color bar indicates the range of t-values with white/yellow representing more significant differences (higher t-values), orange indicating less significant differences (middle range t-values), and red indicating nonsignificant differences (lower t-values). (a) Sagittal view; (b) Coronal view; (c) Axial view. The cursor is positioned in the Montreal Neurological Institute coordinates with the maximum t-value [−6, −84, 2 mm (red arrow)].

