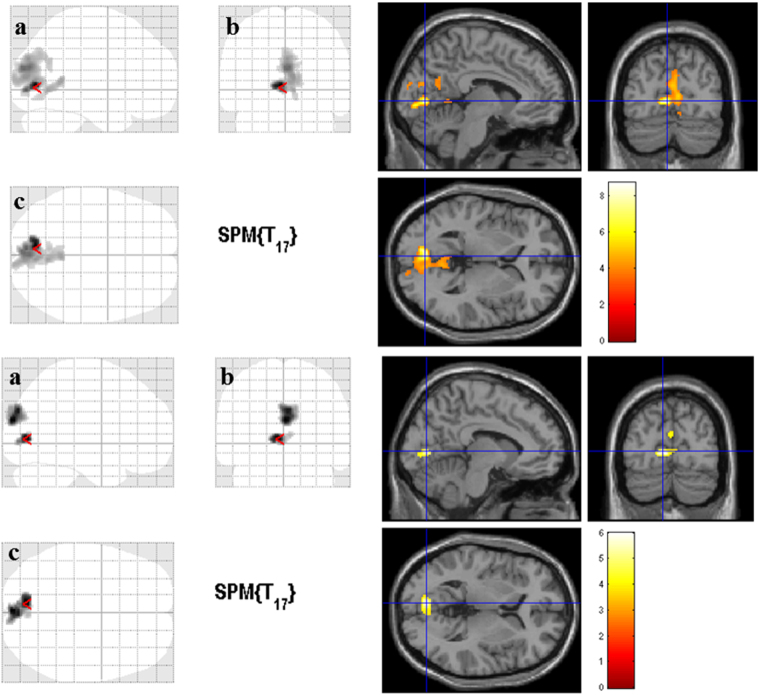
Figure 2.
Correlations between cortical gray matter volume and visual field loss in the Retinitis Pigmentosa patients. The same altered regions (Fig. 1) present a correlation between cortical gray matter volume and visual field extent in the Retinitis Pigmentosa patients (p < 0.001 with a cluster correction of 150 voxels). In the upper part, it is represented the direct (positive) correlation between gray matter volume and visual field diameter (in degrees). A smaller visual field diameter corresponds to reduced gray matter volume. In the lower part, it is displayed the inverse (negative) correlation between mean deficit (in dB) and gray matter volume. High mean deficit values correspond to reduced gray matter volumes. The color bar indicates the range of t-values with white/yellow representing more significant differences (higher t-values), orange indicating less significant differences (middle range t-values), and red indicating nonsignificant differences (lower t-values). (a) Sagittal view; (b) Coronal view; (c) Axial view. The cursor is positioned in the Montreal Neurological Institute coordinates with the maximum t-value [upper part −6, −76, 2 mm; lower part −8, −78, 4 mm (red arrow)].

