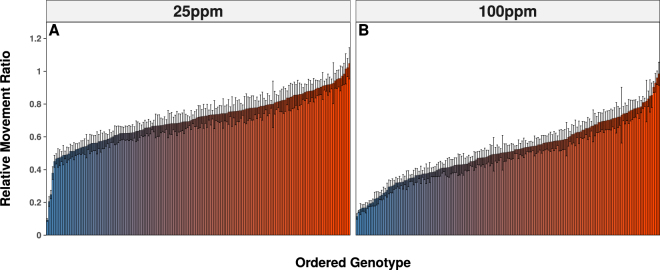
Figure 1.
Phenotypic Spread of the DGRP. Imidacloprid response in the DGRP was assessed using the Wiggle Index at 2 doses (A) 25 ppm and (B) 100 ppm. Relative movement ratios represent the amount of imidacloprid response with a value of 1 reflecting no response and 0 the most substantial response. At each dose there was a spectrum of phenotypic responses ranging from susceptible (blue) to resistant (red). Error bars represent the standard error of the mean.

