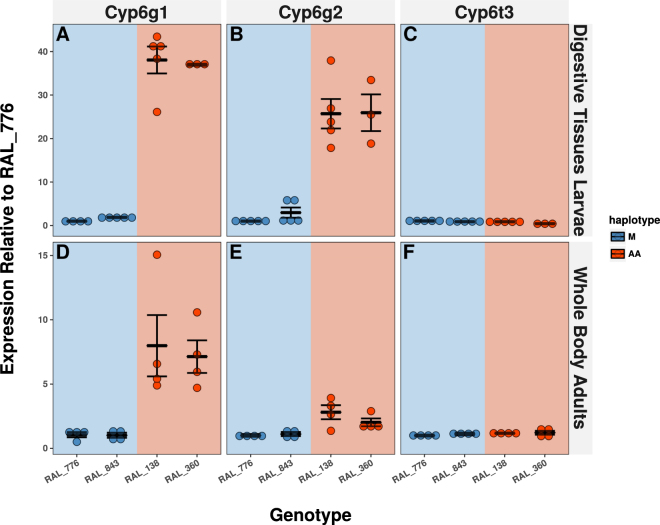
Figure 5.
The Expression of P450s of the Cyp6g1 Locus in the Digestive Tissues. The expression of (A) Cyp6g1 (B) Cyp6g2 and (C) Cyp6t3 was quantified in the digestive tissues of third instar larvae in 4 DGRP genotypes. M haplotypes are represented by blue points and AA haplotypes by red. The whole body expression data presented by Huang et al.31 is presented for the same genes (D–F). Error bars reflect the standard error of the mean. Significant differences were detected between all Cyp6g1 and Cyp6g2 measurements between M and AA haplotypes (ANOVA Tukey’s honestly significant difference) with p-values reported in Supplementary Table S5.

