
Figure 2.
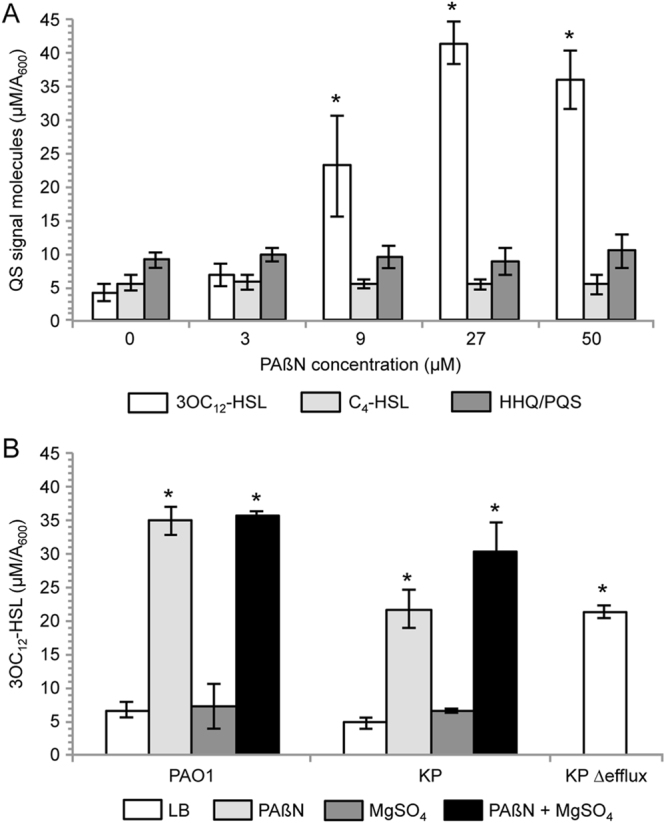
Effect of PAβN on QS signal molecules production. (A) 3OC12-HSL (white bars), C4-HSL (light-grey bars) and HHQ/PQS (dark-grey bars) production in P. aeruginosa PAO1 stationary phase cultures grown in LB or in LB supplemented with PAßN at the concentrations indicated below the histogram. (B) 3OC12-HSL production in the indicated strains grown in LB (white bars), or in LB supplemented with 27 µM with PAßN (light-grey bars), with 1 mM MgSO4 (dark-grey bars), or with 27 µM PAßN plus 1 mM MgSO4 (black bars). The average of at least three independent experiments is reported with SD; statistical significance with respect to the untreated sample is indicated with one asterisk (p < 0.05).