
Fig. 2.
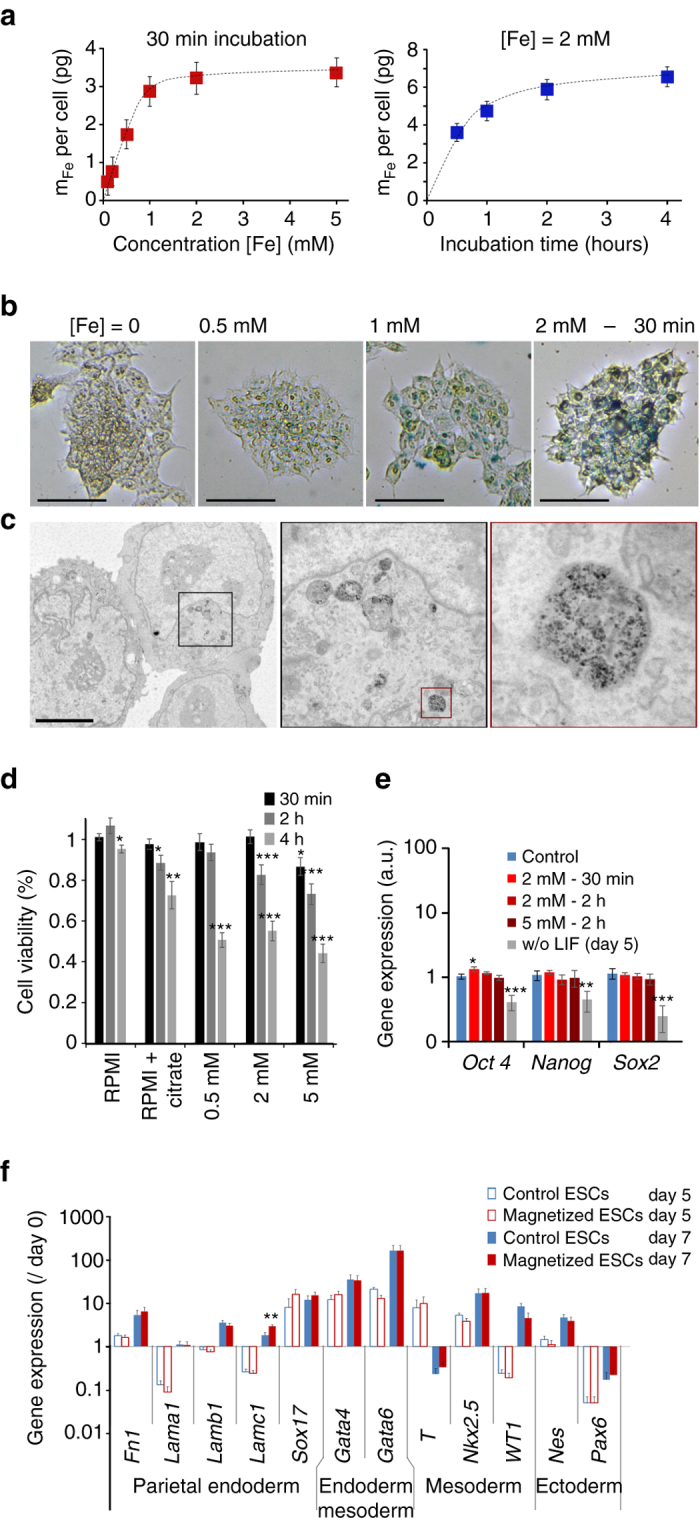
Optimization of embryonic stem cell (ESC) magnetic labeling. a Magnetic labeling of ESCs at different extracellular iron concentrations (for a fixed incubation time of 30 min) and during different incubation periods (for a fixed iron concentration of [Fe] = 2 mM). b Perls’ Prussian blue staining of ESCs after labeling with different concentrations of extracellular iron (between 0.5 mM and 2 mM), and a fixed incubation time of 30 min. Scale bar: 250 µm. c Transmission electron micrograph of ESC after labeling for 30 min at [Fe] = 2 mM (successive zooms of framed areas). Scale bar: 5 µm. Nanoparticles are all located inside the lysosomes. d Cell viability testing using Alamar Blue detection of cell metabolic activity. Cell viability was calculated relative to the control (unlabeled cells in complete medium) and was measured 2 h after different incubation periods (in RPMI) with different extracellular iron concentrations and incubation times. e Expression of pluripotency genes Oct4, Nanog and Sox2 measured by real-time PCR. The gene expression level was calculated with respect to RPLP0 mRNA and expressed as compared to control (unlabeled cells, cultured in complete medium with LIF, = 1 ± SEM). A positive control was added in which the LIF has been removed during 5 days before analysis (culture in complete medium without LIF). One can note that only one condition led to a significant upregulation (Oct4—incubation at 2 mM for 30 min). However the gene was upregulated <1.5-fold (1.3-fold exactly). Besides, higher doses (2 h incubation at 2 and 5 mM) provide the same Oct4 expression as the control. f Expression of several genes characteristic of the different embryonic layers in hanging drop EB formation conditions with 1000 unlabeled (control, blue bars) or labeled cells (magnetic, red bars), 5 days (open bars) and 7 days (solid bars) after initiation of differentiation. All values were calculated with respect to RPLP0 mRNA and normalized by the expression value of the same gene measured at day 0. Two-sample t-test was used to compare the control group with the magnetic group, for same gene and same day; *p < 0.05; **p < 0.01; ***p < 0.001. All error bars represent the SEM