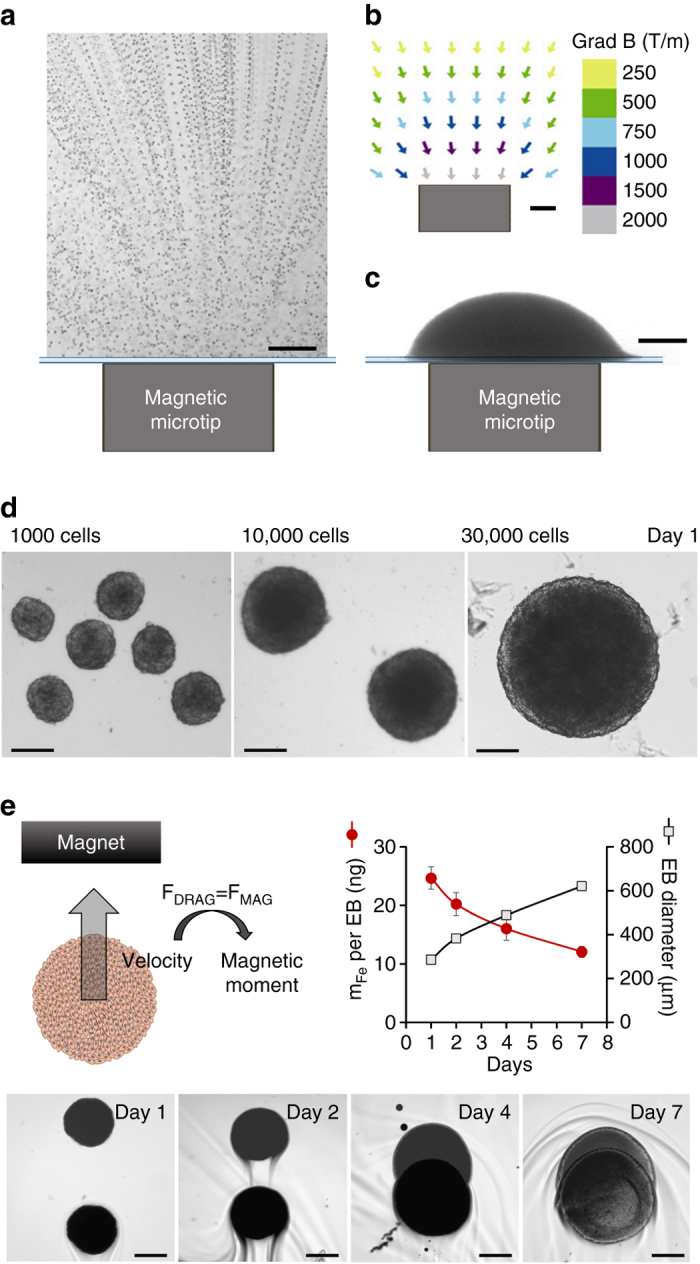
Fig. 3.

Magnetic formation of embryoid bodies. a ESC attraction by a magnetic microtip (750 µm in diameter). To visualize cell movement, the microtip was introduced into a chamber containing suspended cells under a microscope, and cell movements were video-monitored with a ×10 objective. Here 100 movie images were superimposed (0.1 s time intervals) in order to directly observe the trajectories of the cells migrating towards the magnetic microtip. At 1 mm from the microtip, the cells migrate at an average velocity of 300 µm/s, which corresponds to an iron mass of 3 pg cell in a magnetic field gradient of 300 mT/mm. b The field gradient was mapped around the microtip by studying the migration of monodisperse magnetic beads with a calibrated diameter of 4.6 µm (Dynal). At 1 mm from the microtip, it was 300 mT/mm. Scale bar: 200 µm. c Final image of the aggregate obtained 1 min after seeding 30 000 ESCs over the magnetic microtip. Scale bar: 200 µm. d Microscopic images of embryoid bodies (EBs) on day 1, obtained by seeding 1000, 10,000 and 30,000 cells per microtip. Scale bar: 200 µm. e Monitoring of EBs magnetism over 7 days after nanoparticles cellular incorporation, and EB formation (day 0). It consists of tracking the EB magnetic migration towards a magnet, and measuring the corresponding velocity, which translates into the EB magnetic moment (proportional to the mass of iron per EB) by balancing the viscous drag and the magnetic force. Typical migrations are shown for the different times (days 1, 2, 4 and 7), corresponding to the superimposition of two images at 3 s interval. Scale bar: 200 µm. The mass of iron (circles) and the EBs diameters (squares), averaged over eight different EBs, were then plotted as a function of time. Error bars represent the SEM
