Fig. 3.
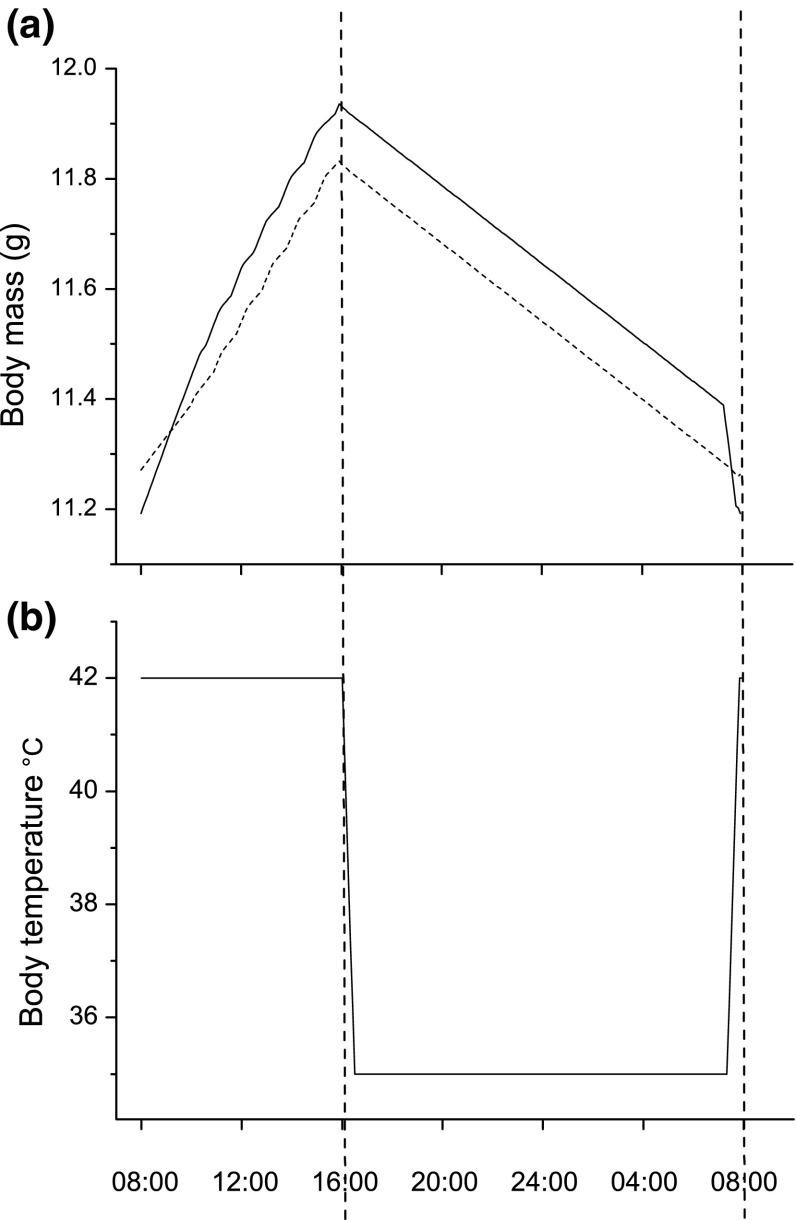
Optimal body mass (a) and body temperature (b) trajectories a day in mid-winter if the maximum hypothermic save is 30%. The dotted, vertical, lines show the beginning and end of the night, respectively. In a, there is no extra warming up cost for the dashed curve and 6 kJ extra warming up cost for the solid curve. The curves show the means for 1000 “individuals” in the forward iteration. No dispersion bars are shown as the standard deviation is almost symmetric below 0.03 for all data points in both curves. To include such small error bars would have no other effect than to make the curves appear very thick and blurry, thereby decreasing the clarity of the figure

