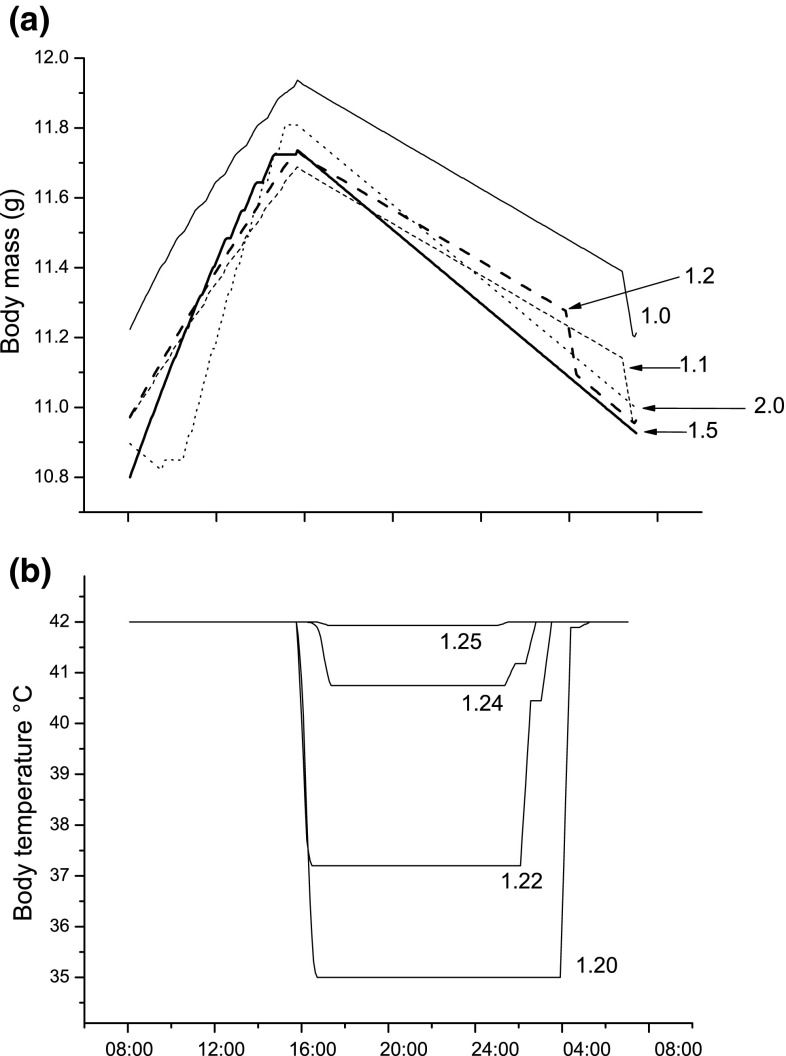
Fig. 4.
Optimal body mass (a) and body temperature (b) trajectories under various food availability regimes, i.e., various values of ∆. This factor gives the same proportional increase of food availability under both good and bad weather conditions. For example, ∆ = 1.2, which means that food availability has increased with 20% compared to baseline conditions. The curves are produced in the same way as Fig. 3 in the forward iteration

