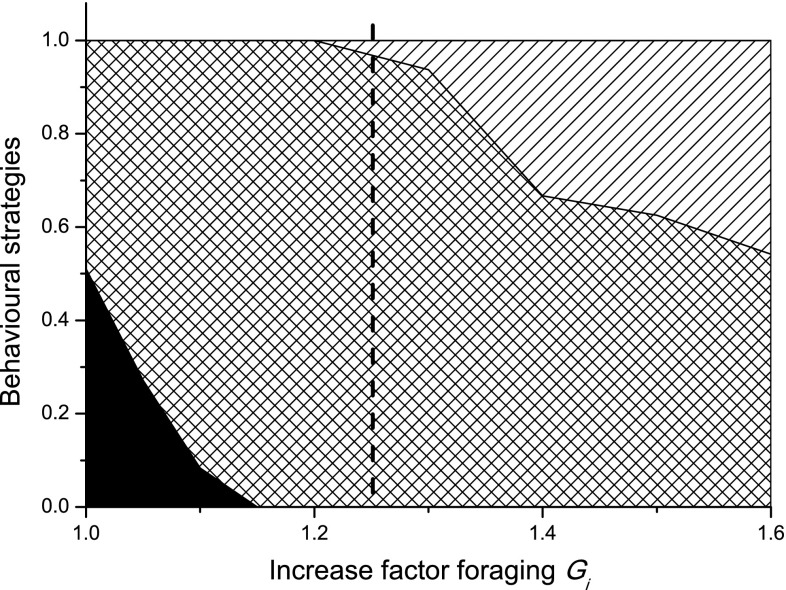
Fig. 5.
Optimal behavioural strategies as a function of food availability plotted as proportion of the day spent on an activity. On the x-axis, 1.0 is the baseline value of ∆. The plot shows the proportion of the day spent on high intensive foraging (behaviour 1; black), low-intensity foraging (behaviour 2; crossed) and resting in safety (behaviour 3; diagonally hatched). The dotted vertical line shows the G i value when night-time hypothermia is completely abandoned

