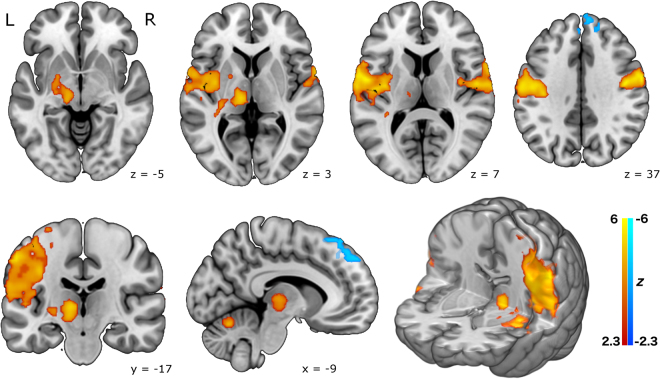
Figure 2.
Brain activation in the naturalistic smoking experiment, from a group mean analysis of 10 healthy smokers, including physiological noise modelling. Top row: axial slices. Bottom row: (from left) coronal slice, sagittal slice, and a 3D rendered image. The pattern of activation is broadly similar to the cued experiment, but somewhat less robust, and less widespread. Statistical maps are shown thresholded at Z > 2.3, p < 0.05 (cluster corrected for multiple comparisons) and neurological convention is used (L = Left, R = Right). Background anatomical image is a high-resolution version of the MNI152 T1 anatomical template.

