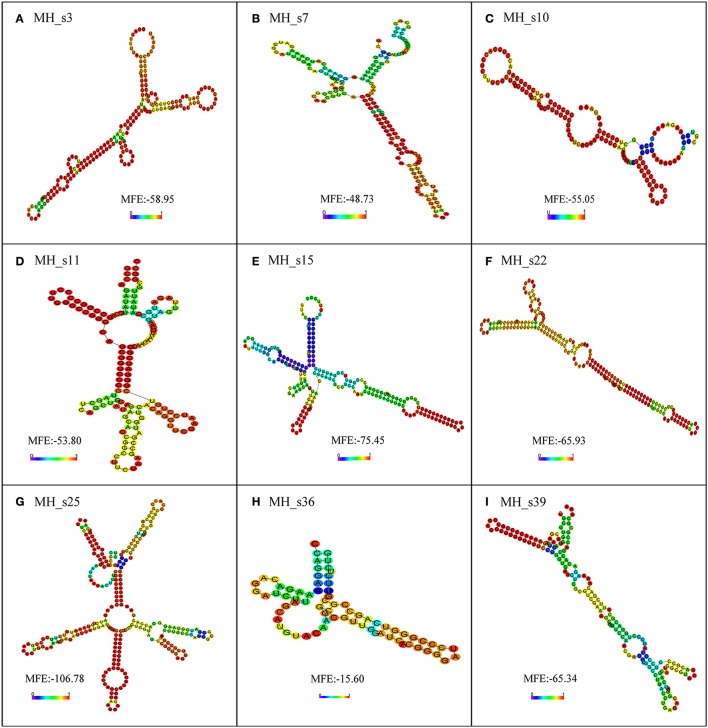
Figure 4.
The secondary structure prediction of nine small RNAs determined by using RNA-fold. The secondary structures are colored according to the base-pairing probabilities. The unpaired regions are colored according to the probabilities of being unpaired. The lowest minimum free energy (MFE) of each sRNA, analyzed using RNA-fold, is shown in the diagram. (A) Secondary structure of MH_s3; (B) Secondary structure of MH_s7; (C) Secondary structure of MH_s10; (D) Secondary structure of MH_s11; (E) Secondary structure of MH_s15; (F) Secondary structure of MH_s22; (G) Secondary structure of MH_s25; (H) Secondary structure of MH_s36; (I) Secondary structure of MH_s39.

