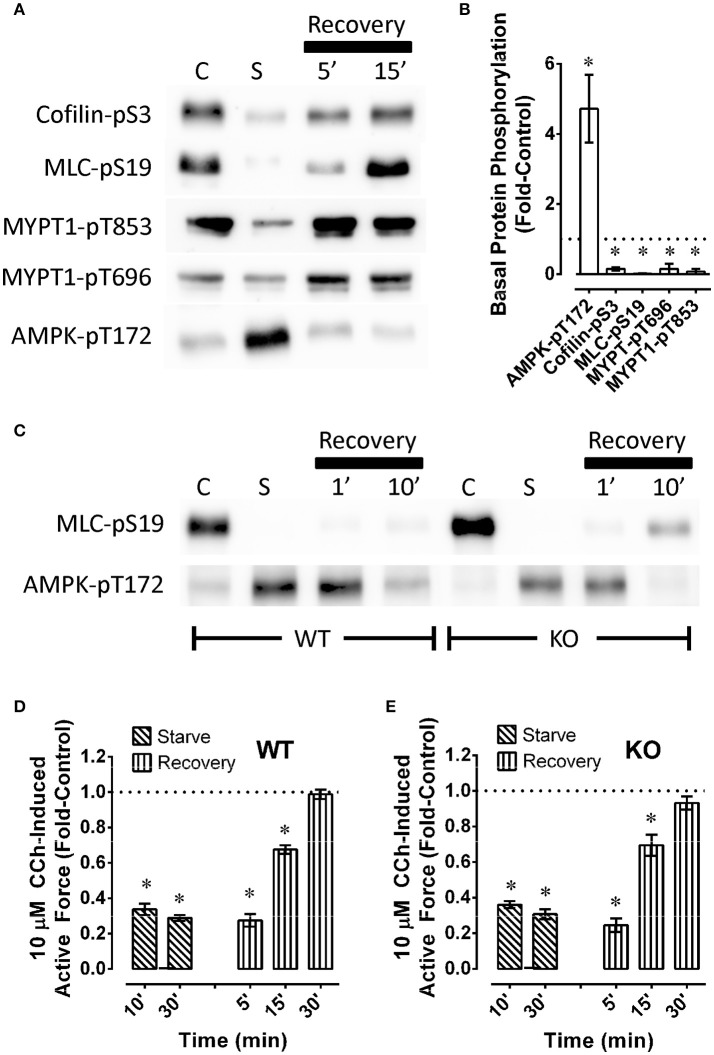
Figure 7.
Examples (A,C) and summary data (B,D,E) of phosphoproteins (A–C) and carbachol (CCh)-induced maximum force (D,E) in wild type [A–C (WT) and D] and AMPK [C (KO) and E] mouse bladder. In (A,C), “C” and “S” refer to, respectively, control and starved, and “Recovery” refers to recovery (glucose and O2 repletion) from starvation (glucose and O2 deprivation). Data (B,D,E) are means ± SE, n = 3–6. *P < 0.05 compared to 1. In (B), responses to starvation (column “C” in A) are normalized to (divided by) control responses (column “C” in A) and reported as “Fold-Control” (see “Methods”).

