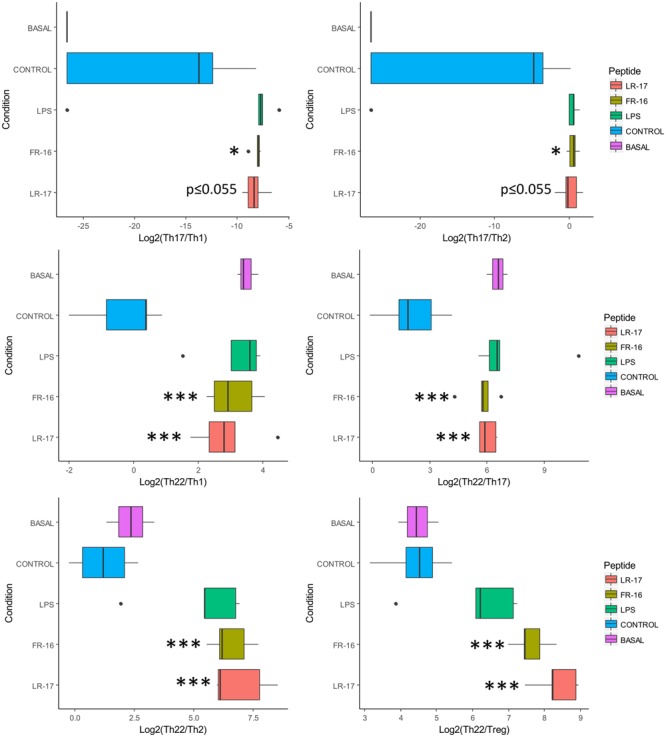
FIGURE 3.

Ratios affected by the presence of peptides LR17 and FR16. Boxplots represent median and interquartile range for the ratios (see all in Supplementary Figure S2). Significant differences were assessed by the non-parametric Mann–Whitney U test and are represented with ∗, ∗∗, or ∗∗∗ (p < 0.05, 0.01, or 0.001 respectively). Significant differences refer to control conditions (PBMCs + anti-CD3).
