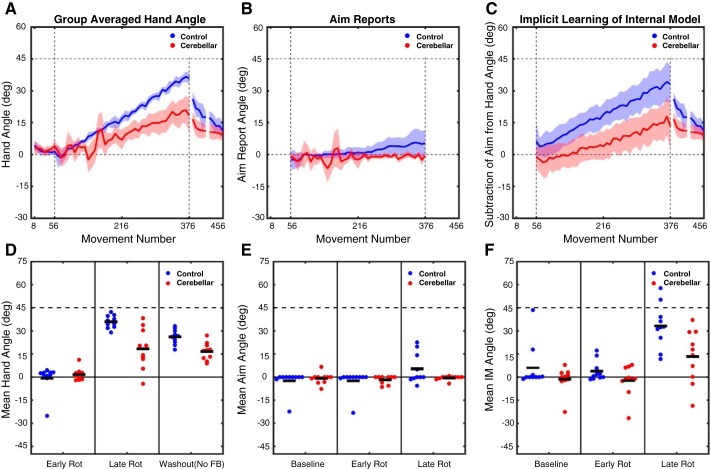
Fig. 3.
Experiment 2: gradual rotation performance metrics. A–C: group-averaged data for hand heading angle (A), aim reports (B), and estimates of implicit learning (C; hand heading angle − aim). Data are based on averages taken over bins of 8 trials for each participant and then averaged across participants for each group. Shaded lines represent confidence intervals around the mean. Bins are marked with the trial number of the last trial of that bin. D–F: individual participant data (dots) and group means (horizontal bar) for hand heading angle (D), aim report (E), and implicit learning estimate (F), with the data averaged over the first 8 trials of the rotation block, the last 8 trials of the rotation block, or the first 8 trials of the no-feedback washout block.

