
Fig. 7.
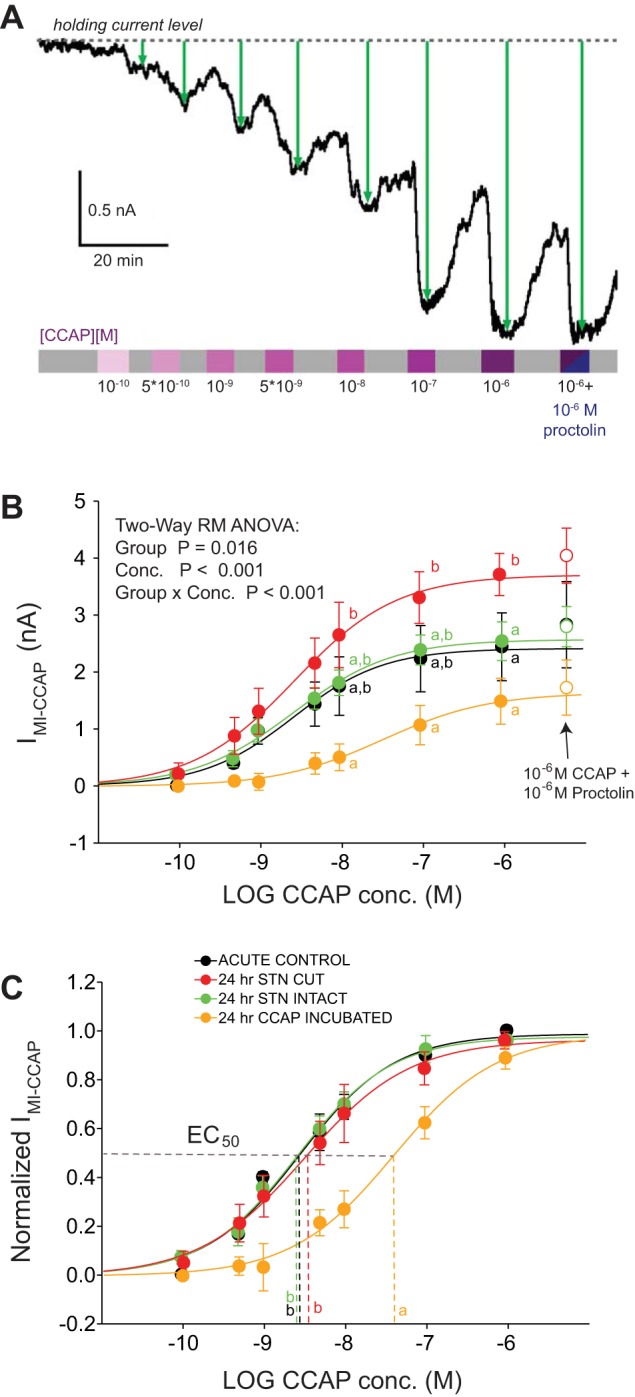
IMI-CCAP in LP cells differs in amplitude and concentration dependence across experimental groups. A: representative recording of CCAP-evoked IMI measurements. LP membrane potential was held via 2-electrode voltage clamp at −20 mV, and CCAP was applied in increasing concentrations from 0.1 nM to 1 μM for 6 min with a saline wash between each concentration. Current amplitudes were calculated as the maximal difference from the holding current before CCAP application (green line). In some experiments, proctolin was applied in combination with CCAP to test for occlusion effects. B: mean current values at different CCAP concentrations from measurements at −20 mV in 4 experimental groups (n = 5 per group). Sigmoid fits were generated from mean current levels averaged across individual experiments. Maximum current levels varied significantly across experimental groups as revealed by 2-way repeated-measures ANOVA. Post hoc analyses reveal that the maximal current elicited at 10−6 M was significantly larger in 24-h stn-cut preparations than in all 3 of the other groups. Groups designated with different superscripted letters show significant differences from one another for a given concentration of CCAP. Perfusion of proctolin (10−6 M) and CCAP (10−6 M) after the 10−6 M CCAP perfusion showed that proctolin caused no further significant increase in the current elicited for any of the 4 experimental groups (open circles), suggesting that CCAP occludes the effect of proctolin. C: same data as in A, but normalized to the maximal current in each experiment. Values for EC50 were significantly different across groups (P < 0.005, 1-way ANOVA—data were log transformed before analysis to match requirement for normality), with the EC50 smaller in all 3 groups relative to the CCAP-incubated group. Groups designated with different superscripted letters show significant differences from one another for EC50 of CCAP.