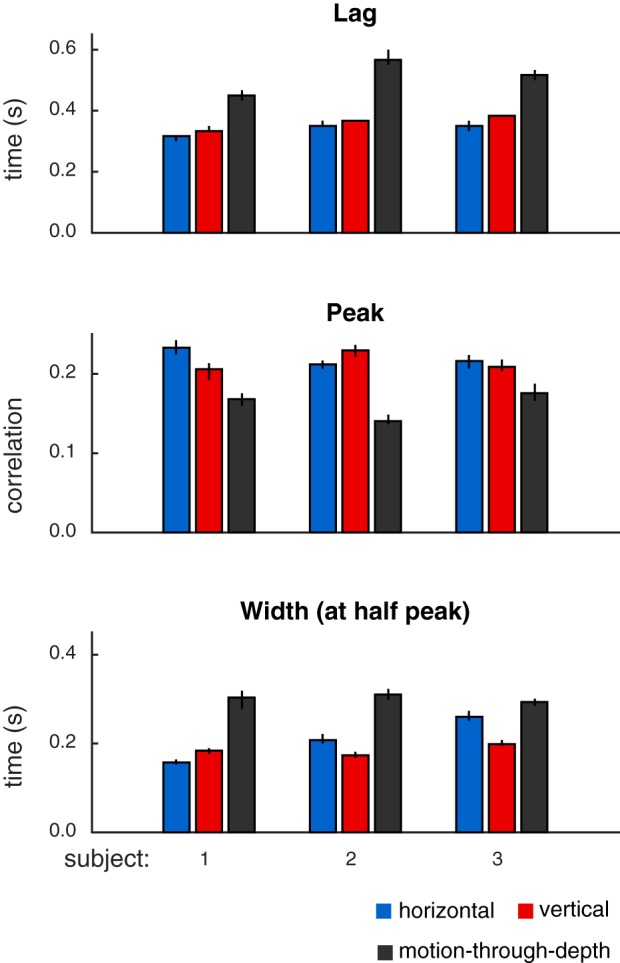
Fig. 3.

Summary of features of tracking performance in experiment I, calculated from CCGs shown in Fig. 2. Features (top: lags; middle: peaks; bottom: width at half peak) indicate consistently better performance (shorter lags, higher peak correlation values, and smaller CCG widths) for tracking frontoparallel motion compared with motion-through-depth for a target moving in a Brownian random walk. Bar height indicates median values, and error bars show 95% confidence intervals.
