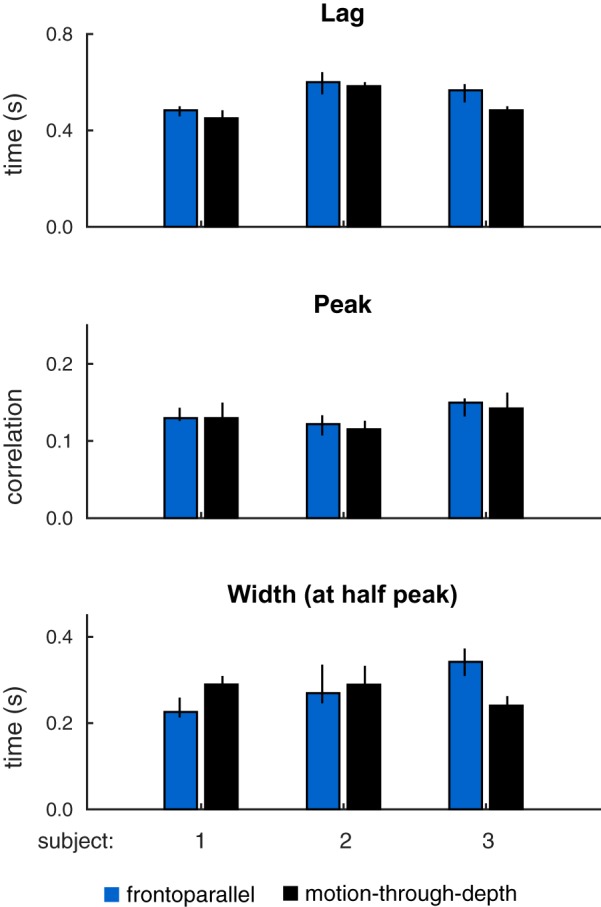
Fig. 14.

Summary of features of tracking performance from depth (black) and frontoparallel (blue) CCGs pictured in Fig. 13. Bar heights indicate median values, and error bars show 95% confidence intervals. Features (top: lags; middle: peaks; bottom: width at half peak) are similar across motion-through-depth tracking and frontoparallel tracking. In particular, the latency difference between frontoparallel motion tracking performance and motion-through-depth tracking performance is negligible or reversed (see Table 7).
