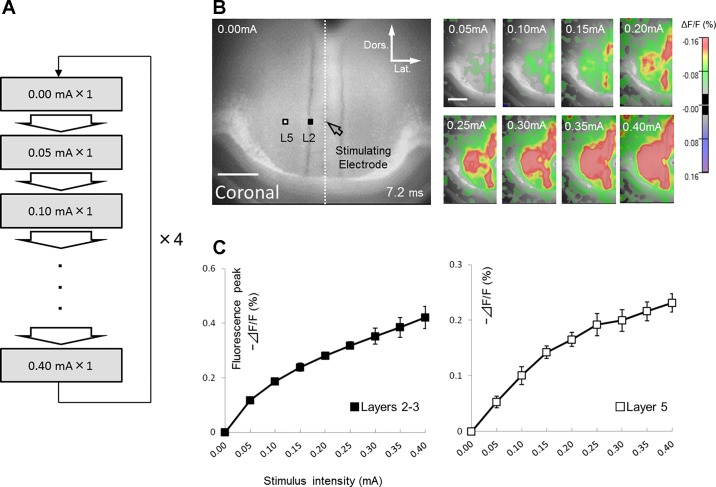
Fig. 2.
Determination of the optimal stimulus intensity. A: recording procedure for stimulus intensity experiment. B: representative examples of optical responses recorded from a GRS coronal slice stained with Di-4-ANNEPS. Left: reference image of slice. The location of stimulus site is indicated by open arrow. In this and following figures, scale bar, 500 µm, is applied. White and black squares show the sites in layer 2 and 5, respectively where the optical responses were taken to draw input-output relationship graphs shown in C. In this case, the location of each site was at around 0.20 mm and 0.46 mm lateral to the stimulating electrode, respectively. Right: optical responses evoked in left hemisphere (region of interest, ROI) by 0.05 to 0.4 mA stimulation (indicated in each panel). Optical responses are presented as pseudo-color images. Red color illustrates a decrease in fluorescence, reflecting membrane depolarization. These optical responses were taken 7.2 ms after stimulation. In this and following figures, value indicated at the bottom of images indicates the time when the images were taken from the stimulation. C: the relationship between the stimulus intensity (0.05 mA steps from 0.00 to 0.40 mA) and optical signals (−ΔF/F). Data are presented as mean ± SE (n = 5).

