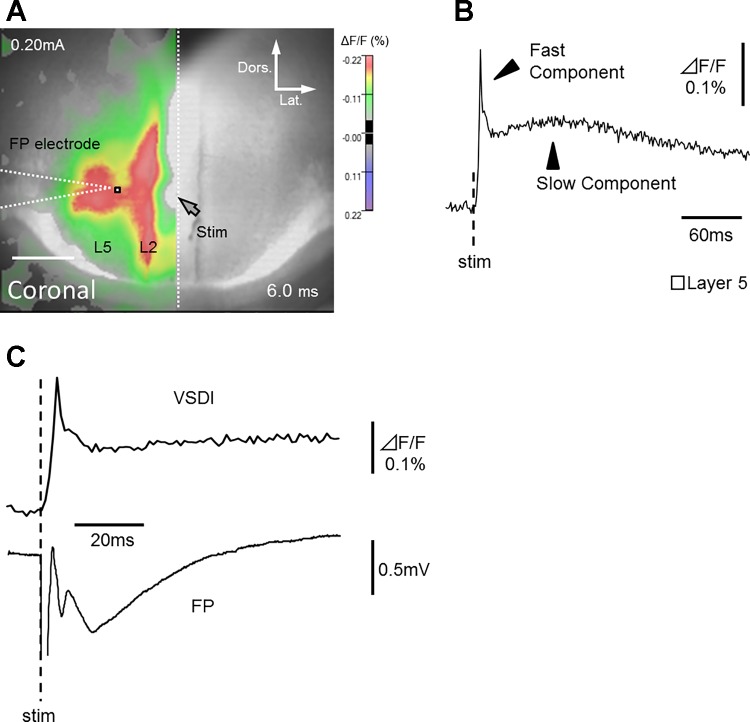
Fig. 3.
Comparison of optical responses with simultaneously recorded field potentials. A: optical signal superimposed on reference image. Location of glass micro-electrode used for FP recording is also indicated as white dashed line. White dotted line indicates cortical midline. Only the optical signals of responsible area (left hemisphere) is shown. B: trace of fast and slow optical components in layer 5 (white square in A). C: fast optical component and simultaneously recorded FP.

