Fig. 5.
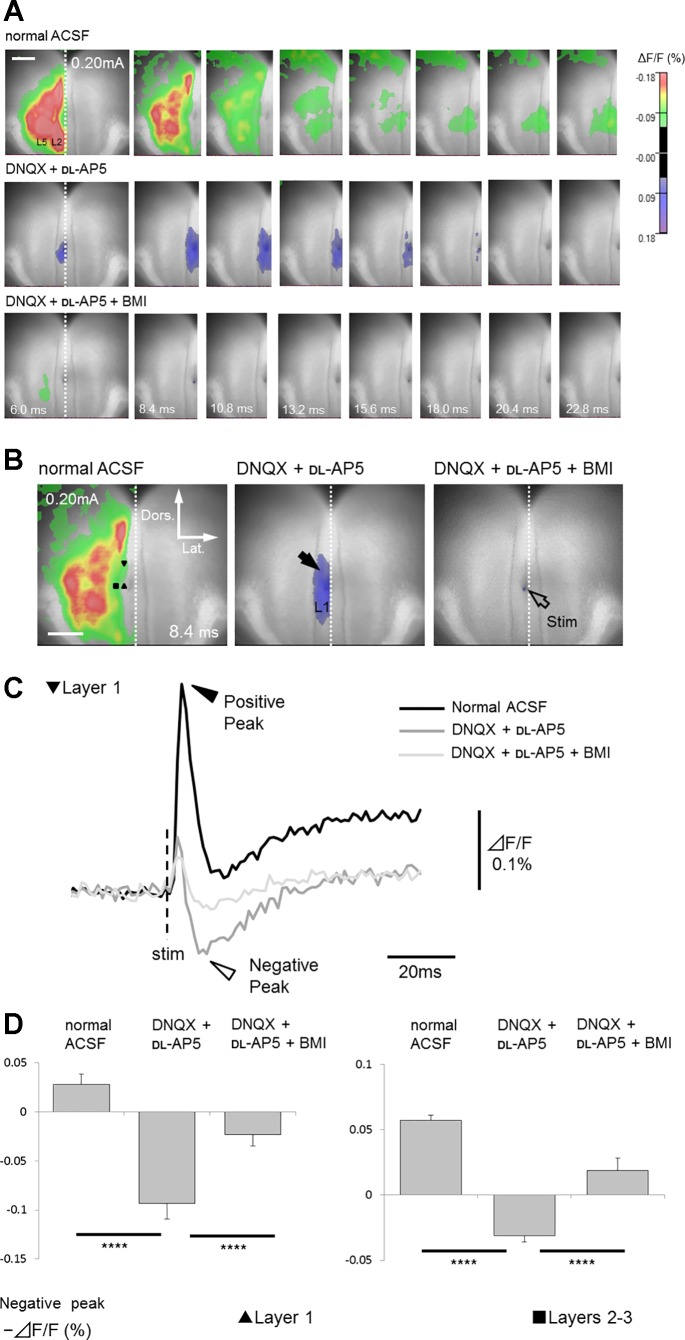
Effects of glutamate and GABA antagonists application on optical responses recorded from coronal slice. A: top panels show the time course of signal transmission in normal ACSF. As shown in middle panels, excitatory events were mostly blocked by antagonists of ionotropic glutamate receptors (40 µM DNQX and 50 µM dl-AP5) both in superficial (layers 2–3, ΔF/F = 0.085 ± 0.013%; P < 0.001) and deep layers (layer 5, ΔF/F = 0.038 ± 0.011%; P < 0.005) (n = 5 slices of 5; data at the peak latency in normal ACSF). In the presence of these antagonists, negative signals (blue color indicates an increase in fluorescence reflecting membrane hyperpolarization) were occasionally detected mainly in superficial layers (see also Supplemental Movie S2). These negative signals were almost completely inhibited by the GABAA receptor antagonist bicuculline (20 µM, bottom panels), indicating that they were monosynaptic inhibitory responses (fIPSPs). Only left hemisphere (ROI) is shown. B: comparison of optical response recorded in normal ACSF with those in the presence of DNQX and dl-AP5, or DNQX, dl-AP5 and BMI. All responses were recorded 8.4 ms after stimulation, corresponding to the time when the maximum inhibitory response in layer 1 was observed in the presence of DNQX and dl-AP5. Black arrow shows fIPSPs in superficial layers. Open arrow indicates stimulation site. C: comparison of the time course of optical responses from layer 1. Black and white arrowheads show positive and negative peaks in fluorescence change traces, respectively. D: comparisons of the negative-peak amplitude (minimum amplitude after positive-peak latency) between each drug conditions in superficial layers (layer 1, black triangle; layers 2–3, black square). Effects of drug conditions were verified by one-way ANOVA [layer 1, F(2, 8) = 91.7, P < 0.001; layers 2–3, F(2, 8) = 48.5, P < 0.001)]. Significant differences are indicated by asterisks (****P < 0.001).

