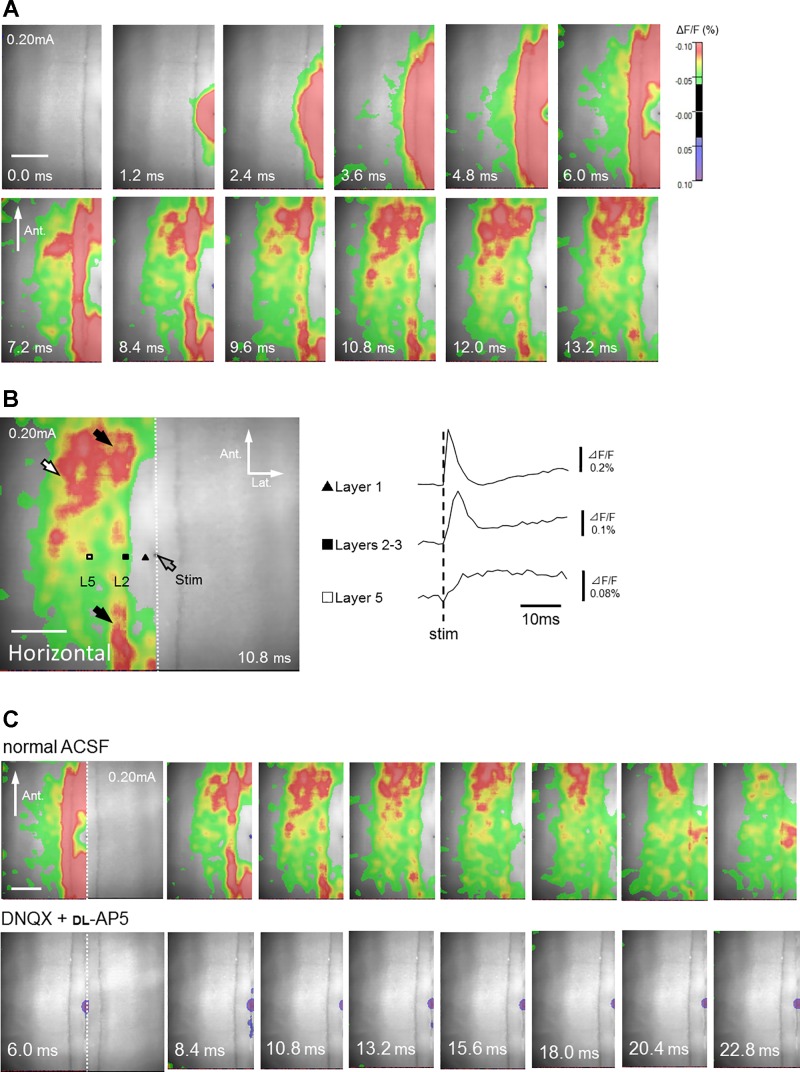
Fig. 8.
Optical responses recorded from horizontal slices. A: time course of fluorescence changes in response to a single electrical stimulation of layer 1a in a horizontal slice (see also Supplemental Movie S3). Only left hemisphere (ROI) is shown. B: time course of optical signals acquired from layer 1 (black triangle), layers 2–3 (black square), and layer 5 (white square). Layer 1a stimulation induced excitatory signals in layers 2–3, and then in layer 5, which later propagated transversely within the same layers (black and white arrows, respectively). The direction of excitation was predominantly from posterior to anterior. C, top: signal transmission time course in normal ACSF. Bottom: excitatory responses were almost abolished by antagonists of ionotropic glutamate receptors (40 µM DNQX and 50 µM dl-AP5) both in superficial (layers 2–3, ΔF/F = 0.039 ± 0.016%; P < 0.001) and deep layers (layer 5, ΔF/F = 0.0067 ± 0.0043%; P < 0.001) (n = 6 slices of 6; data at the peak latency in normal ACSF). Note that inhibitory responses were rare in horizontal slices. Only left hemisphere (ROI) is shown.

