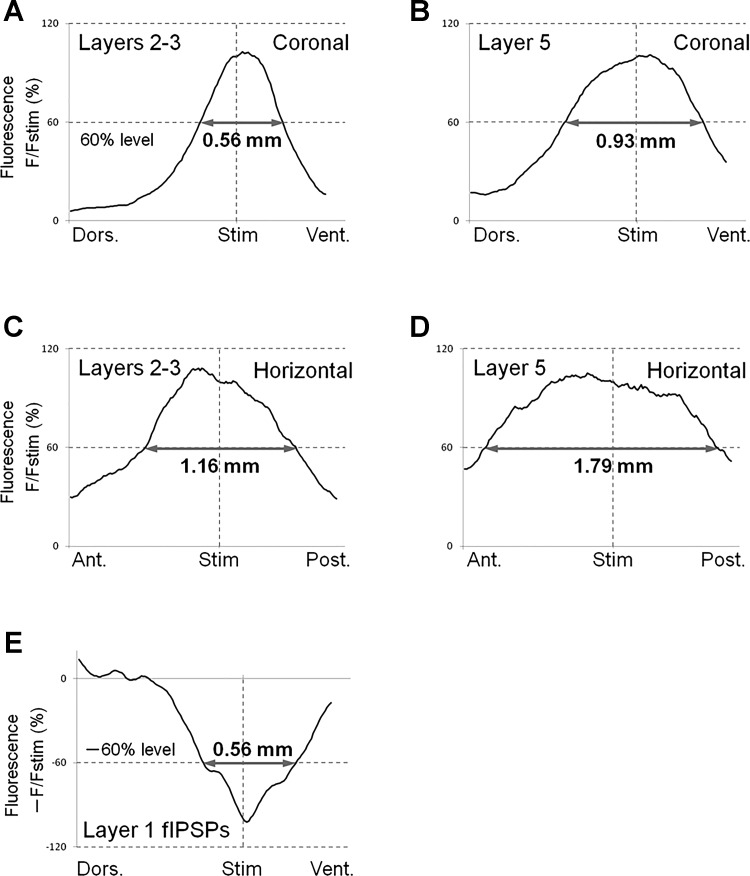
Fig. 9.
Spatial profiles of transverse signal propagation in coronal and horizontal slices. A–D: we used 5 coronal and 6 horizontal slices to obtain averaged spatial profiles of excitation propagation in each plane. For this purpose, spatial distribution of optical responses, in each slice tested, along lines parallel to layers 2–3 or 5 were measured at peak latency. Then, grand average (average of averages) was calculated and plotted as a function of distance from the stimulus site. The lines for analysis were drawn 0.20 mm (layers 2–3) and 0.46 mm (layer 5) lateral to the stimulation electrode in coronal slices, and 0.27 mm (layers 2–3) and 0.61 mm (layer 5) in horizontal slices, respectively. To estimate how spatially widespread the responses in those layers were, we measured 60%–width of the responses (gray arrows in A to D). Note that, in both superficial and deep layers, transverse signal propagation was much broader in horizontal slices, than in coronal slices. E: spatial profile of transverse propagation of inhibitory signals at peak latency in coronal slices. The procedure to draw this graph was similar to that employed in A–D. Data were taken from coronal slices in the presence of DNQX and dl-AP5. The gray arrow shows the 60%–width of the peak response. The track for analysis was 0.086 mm (layer 1) lateral to the stimulating electrode.

