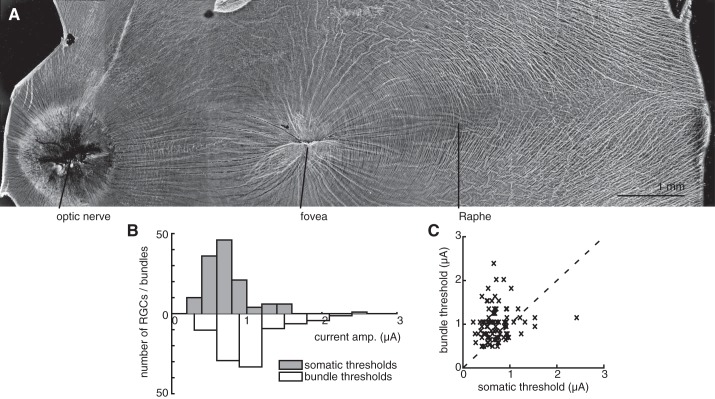
Fig. 9.
Stimulation in the raphe region. A: immunolabeling reveals the raphe region of the primate retina, with a relatively low density of axons. B and C: histogram and scatter plot, respectively, show the RGC somatic threshold vs. bundle thresholds at the same electrodes (see Fig. 6). Seventy-five percent of all electrodes that were able to activate a single RGC (i.e., 16% of all electrodes on the array) did so without bundle activation.

