Fig. 1.
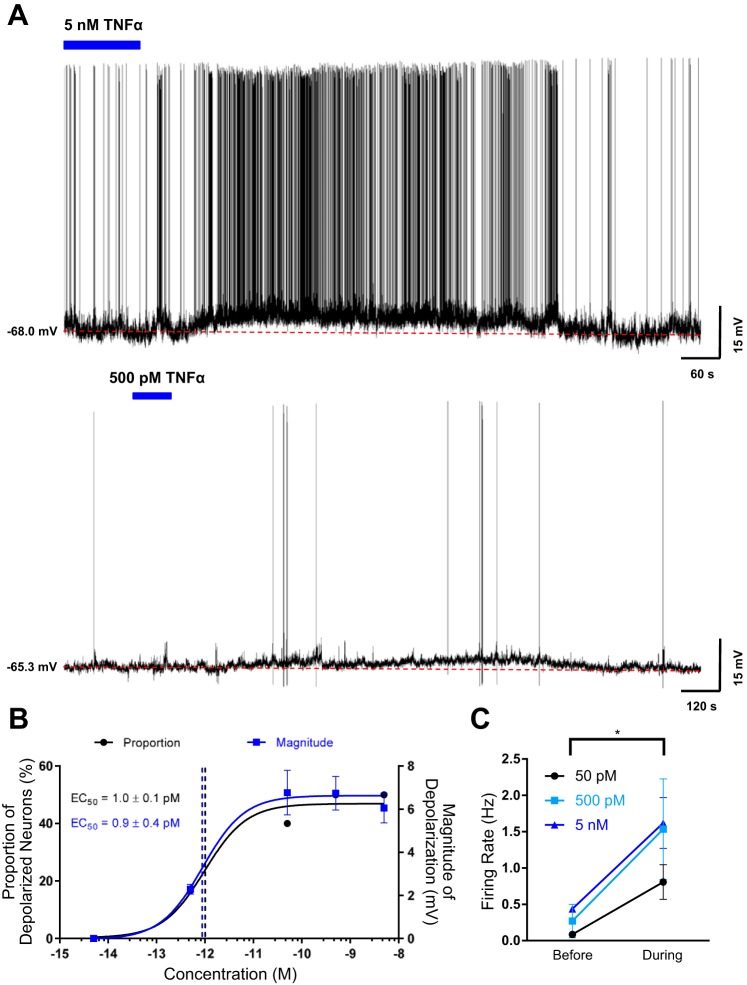
Acute bath application of TNF-α depolarizes subfornical organ (SFO) neurons. A: representative current-clamp recordings from 2 dissociated SFO neurons highlighting that bath application of 5 nM (top) and 500 pM (bottom) TNF-α depolarizes SFO neurons. The blue bar denotes the time and duration of bath application of TNF-α, and the dashed red line denotes the baseline membrane potential before TNF-α bath application. B: proportion of depolarizing SFO neurons (black) and the magnitude of depolarization (blue) at each concentration are shown (n = 62). The data sets were superimposed with a sigmoid concentration-response function, and the EC50 values are highlighted by the dashed vertical lines and as numerical values. C: action potential firing rate before and during bath application of 5 nM (blue), 500 pM (light blue), and 50 pM (black) TNF-α. The firing rates during bath application of TNF-α relative to the firing rates before for each concentration were significantly different (5 nM: Δfiring rate = 0.9 ± 0.3 Hz, *P = 0.04; 500 pM: Δfiring rate = 1.6 ± 0.7 Hz, *P = 0.05; 50 pM: Δfiring rate = 0.8 ± 0.2 Hz, *P = 0.02).

